Sample dataset and analysis 1: Ashar 2022#
Download the Matlab live script
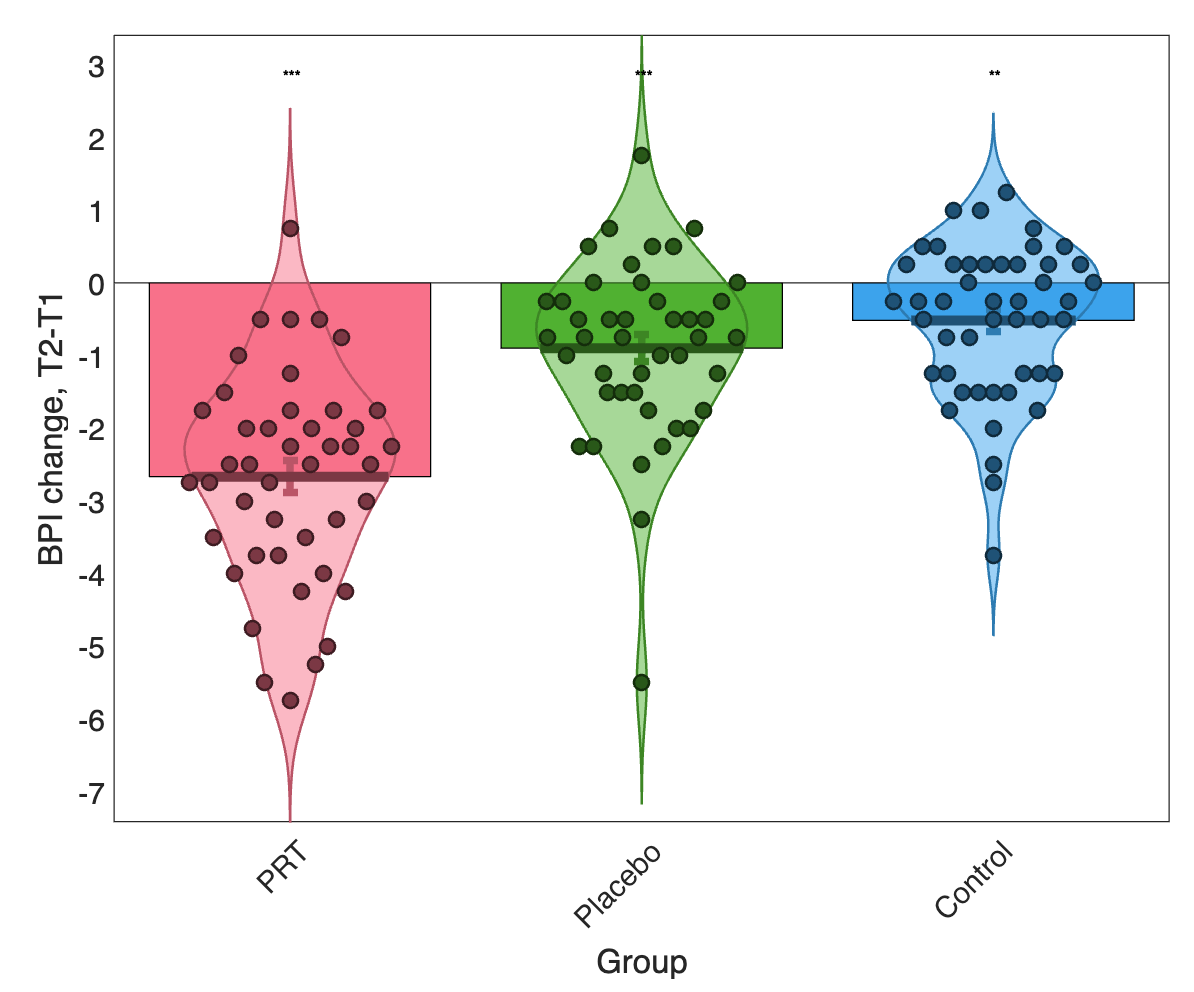
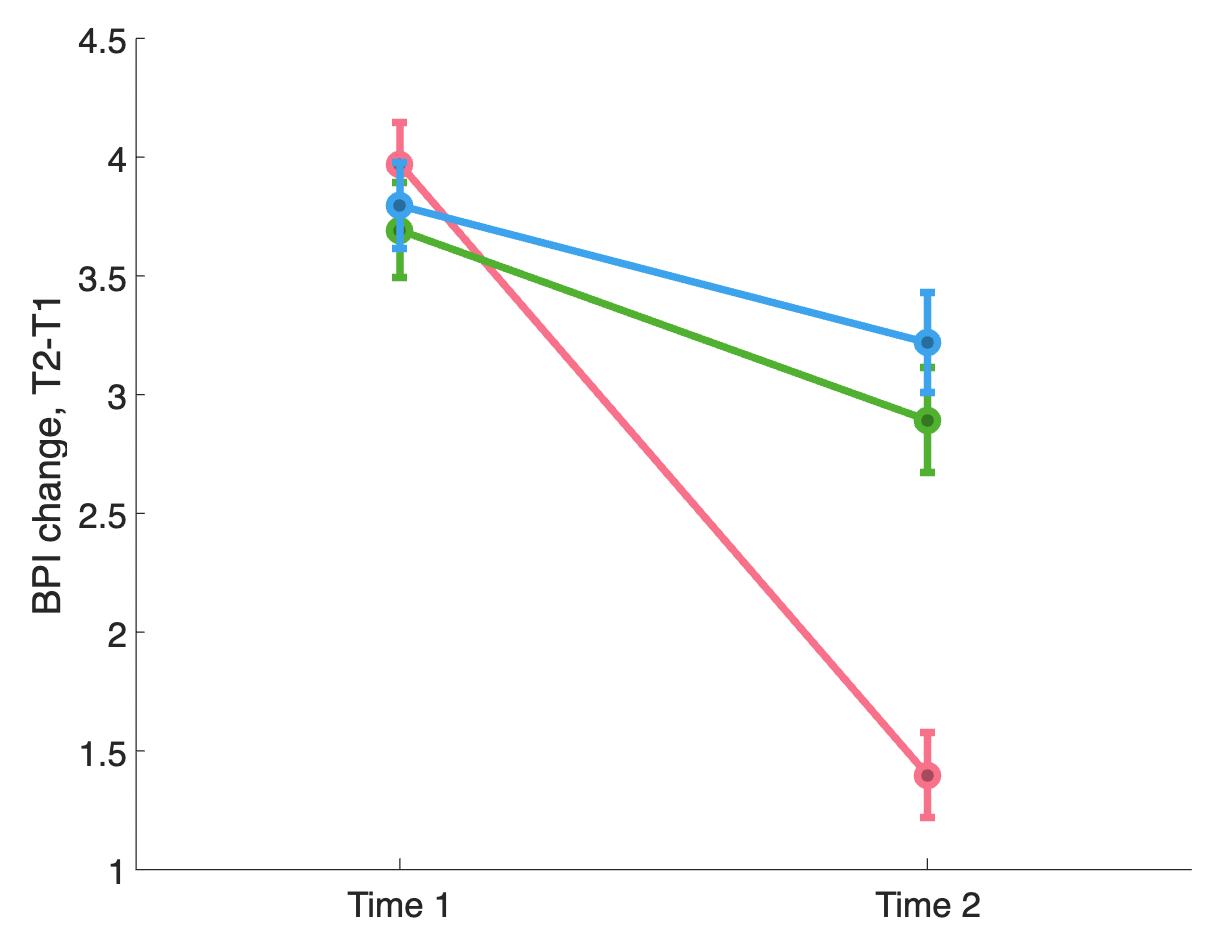
Ashar et al. 2022, JAMA Psychiatry This study is a randomized clinical trial (RCT) of patients with chronic back pain (>= 4/10 pain for at least 3 months, average duration ~10 years). The trial compares Pain Reprocessing Therapy, Placebo (a single injection into the skin of the back), and Usual Care treatments, with pre-treatment and post-treatment (1 month after treatment initiation), and follow-up to 1 year.
Here’s what the improvement looks like for the 3 groups:

Let’s recreate a GLM from scratch and do an analysis of this dataset. The goal: Assess whether pain changes with Pain Reprocessing Therapy treatment and/or placebo treatment relative to usual care.
The walkthrough below loads the dataset in Matlab and creates a simple version of the dataset we’ll work with: NOTE: You will need CANlab Core Tools (canlab.gitub.io) on your Matlab path to recreate the plots.
Activity:#
Use your hand-coded GLM to analyze differences in back pain (BPI) improvement by group.
Include tests of contrasts for PRT - Placebo, and Placebo - Control.
If you’d like to skip the “data wrangling” bit and download these files, they might be helpful:
Ashar dataset simple wide Ashar dataset simple long
Analysis 1: Custom GLM Steps: Code the core GLM equations Create a design matrix(X) that codes for differences among the 3 groups Estimate the model and report output Validate by comparing with an established GLM function Turn your code into a function that you can run on any inputs X, y, and regressor names
Analysis 2: Scaling Explore the relationship between beta-hats and group means What is the relationship between beta-hats in your model and group means for the 3 groups? Why?
Analysis 3: Contrasts So far, we have coded the group comparisons into the design matrix. But we can also apply contrasts after parameter estimation to test the group differences of interest.
Extend your GLM function to include contrasts for group means
Run the GLM with the indicator matrix for groups as X, passing in the contrast matrix C
Compare the output to our previous group difference-coded design matrix
We have fit a model without an intercept. Is this OK? Why or why not?
Answer key For a pre-cooked answer (Matlab), see: this Matlab live script
But…don’t peek! Do it yourself!!!