Benefits of fMRI: Versatility and an Open Community
Overview
The human brain is, pound for pound, the most complex object in the known universe. The neocortex alone holds on the order of 20 billion neurons, each making thousands of connections, embedded among some 30 billion glial cells that participate actively in information processing. The brain’s capacity to represent everything from perceptions of the world to conceptions of the universe emerges from this staggering complexity — and its study has become a meeting point for psychology, statistics, computer science, physics, engineering, medicine, economics, philosophy, and more. The study of the brain is central because it is, after all, the study of us.
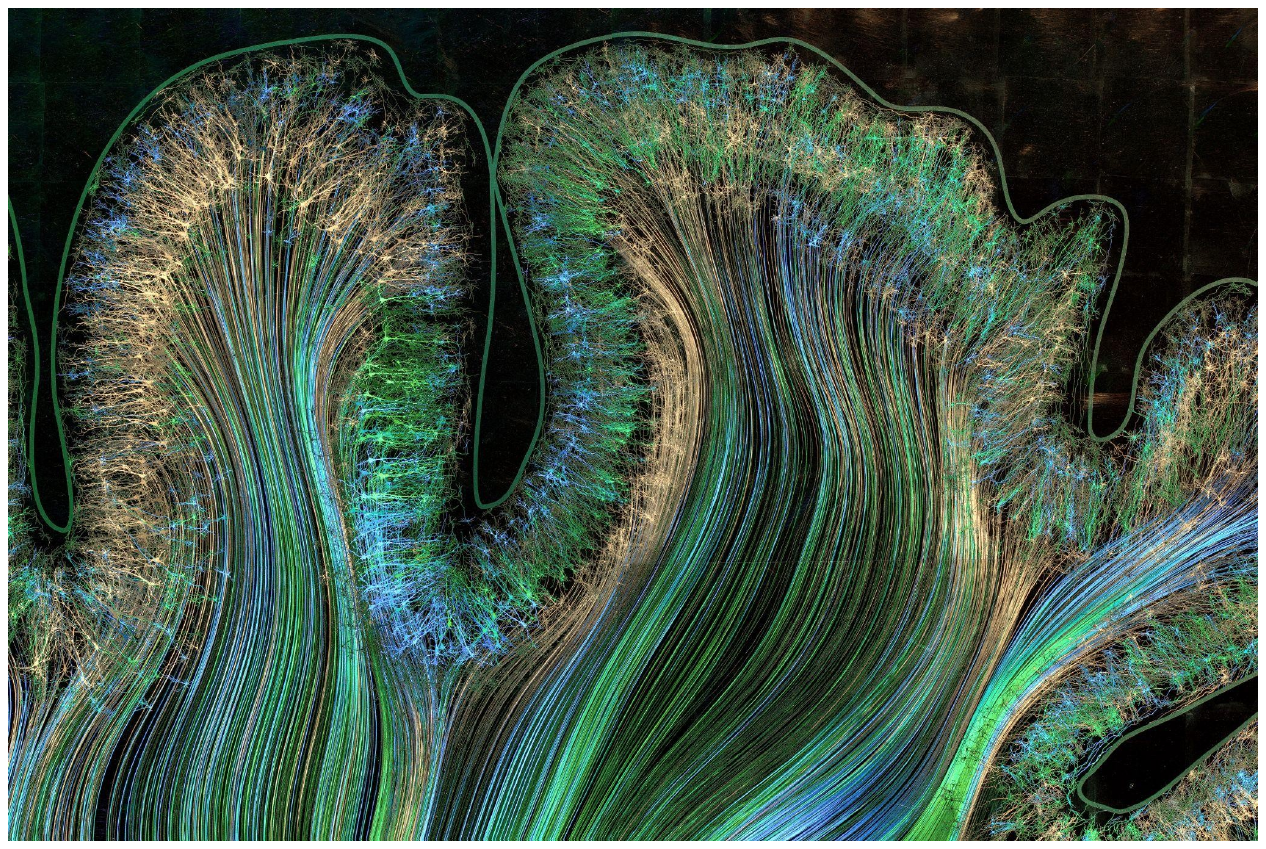
The complexity and beauty of the brain. Motor and parietal cortex, detail from Self Reflected, 22K gold microetching under multicolored light, 2014–2016, Greg Dunn and Brian Edwards, reproduced with permission. (Figure 1.1 from the book. © the authors and MIT Press; reproduced with permission — not covered by this site’s CC-BY license.)
Functional Magnetic Resonance Imaging (fMRI) has become a staple of human neuroscience: it can capture signals related to brain activity and metabolism every second at roughly 320,000 locations across the brain, sampling the processes that let us concentrate, do mental arithmetic, share a joke, or compose music. It complements its cousins in noninvasive functional neuroimaging — PET, EEG, MEG, SPECT, NIRS, and functional ultrasound — each with unique strengths. Scientifically, fMRI offers a rare combination of reasonably high spatial and temporal resolution with even, whole-brain coverage: whole-brain images every second at ~2 mm resolution, or every 200 msec at lower resolution, and with clever designs it can discriminate psychological events as little as 100 msec apart. It is also well suited to longitudinal work — some individuals have been scanned up to 100 times over a few years with no apparent adverse effects, making repeated scanning across development, aging, training, or treatment feasible.
Economics and accessibility matter too. The same MRI scanner used in every major hospital to image knees, backs, and lungs can — with the right software and pulse sequences — do fMRI, making the method widely available. fMRI is roughly three times less expensive than PET (though an order of magnitude more costly than EEG), and because it involves no injection of radioactive tracers, it faces lighter regulatory oversight, opening it to psychologists, health researchers, and behavioral scientists without medical approvals or radiation safety committees.
The social factor may be the most distinctive: fMRI researchers largely see themselves as a community committed to collaborative science and open sharing. The creators of the field’s most popular analysis packages — Statistical Parametric Mapping (SPM), the fMRIB Software Library (FSL), and Analysis of Functional Neuroimages (AFNI) — chose early on to make their software open-source and free, and each is sustained by user communities that have contributed hundreds of open extensions, toolboxes, and pipelines, many catalogued on the NIH’s NITRC clearinghouse or GitHub. A growing open-science movement has added data-sharing repositories: OpenNeuro hosts thousands of complete fMRI datasets; NeuroVault and Neuromaps share statistical brain maps; Neurosynth and BrainMap provide meta-analytic summaries — Neurosynth alone synthesizes findings from over 14,000 publications. Funding agencies went further, prospectively funding studies designed from the outset to be shared: the Human Connectome Project (1,200 healthy adults, now expanding across the lifespan), IMAGEN (2,100 European adolescents), the longitudinal ABCD study (over 10,000 US adolescents), and UK Biobank, which plans brain scans of 100,000 people within a 500,000-person population health sample. Consortia such as ADNI (Alzheimer’s), PPMI (Parkinson’s), and ENIGMA (imaging genetics) pool scientists and data to accelerate progress on brain disorders.
| Study | Sample | Population |
|---|---|---|
| UK Biobank | 100,000 UK adults (planned; 50,000+ released) | Population health |
| ABCD | 10,000 US adolescents, longitudinal | Development |
| OpenNeuro | >10,000 participants across many studies | Multiple |
| INDI / 1000 FC / CoRR | ~5,000 across initiatives | Multiple |
| ABIDE I & II | 2,156 autistic individuals | Autism |
| ADNI 1/2/3 | ~2,500 with Alzheimer’s, MCI, controls | Dementia |
| HCP | 1,200 healthy US adults | Healthy adults |
| dHCP | 1,300, ages 5–21 | Development |
| PPMI | 1,400 (424 with Parkinson’s disease) | Parkinson’s |
| OASIS | 1,674 (150 longitudinal) | Dementia |
| Brain Genomics Superstruct | 1,570, some longitudinal | Healthy adults |
Large-scale studies with open data that can be accessed by the community (adapted from Table 1.1 in the book).
These open resources serve remarkably diverse users: epidemiologists linking risk factors, brain measures, and health outcomes; geneticists studying the heritability of brain structure and function; clinical scientists hunting for diagnostic and prognostic brain measures; cognitive neuroscientists and computational modelers mapping mental processes onto brain function; and biostatisticians, engineers, and data scientists bringing machine learning, network theory, and computational models to bear on the complexity.
A second core advantage is versatility. The same scanner that collects functional images can, with different pulse sequences, produce a remarkable range of image types. Structural images (T1- and T2-weighted) reveal boundaries among gray matter, white matter, and cerebrospinal fluid, with their ratio sensitive to myelin content. Diffusion-weighted imaging tracks the directional diffusion of water along axon bundles, mapping the brain’s major fiber tracts. Angiography (“time-of-flight” imaging) maps blood vessels; elastography pairs vibratory stimulation with sequences that map tissue elasticity, revealing tumors or trauma; other sequences track CSF flow. On the functional side, over 99% of fMRI studies use Blood Oxygen Level-Dependent (BOLD) contrast, which reflects a mix of blood flow and oxygenation tied to metabolic demand. But arterial spin labeling (ASL) provides quantitative cerebral blood flow in absolute units (mL/min) that are stable across months — unlike drifting, unitless BOLD signal — enabling direct comparisons of brain states over time. And MR spectroscopy estimates local concentrations of metabolites and neurochemicals, notably glutamate and GABA, the brain’s major excitatory and inhibitory neurotransmitters.
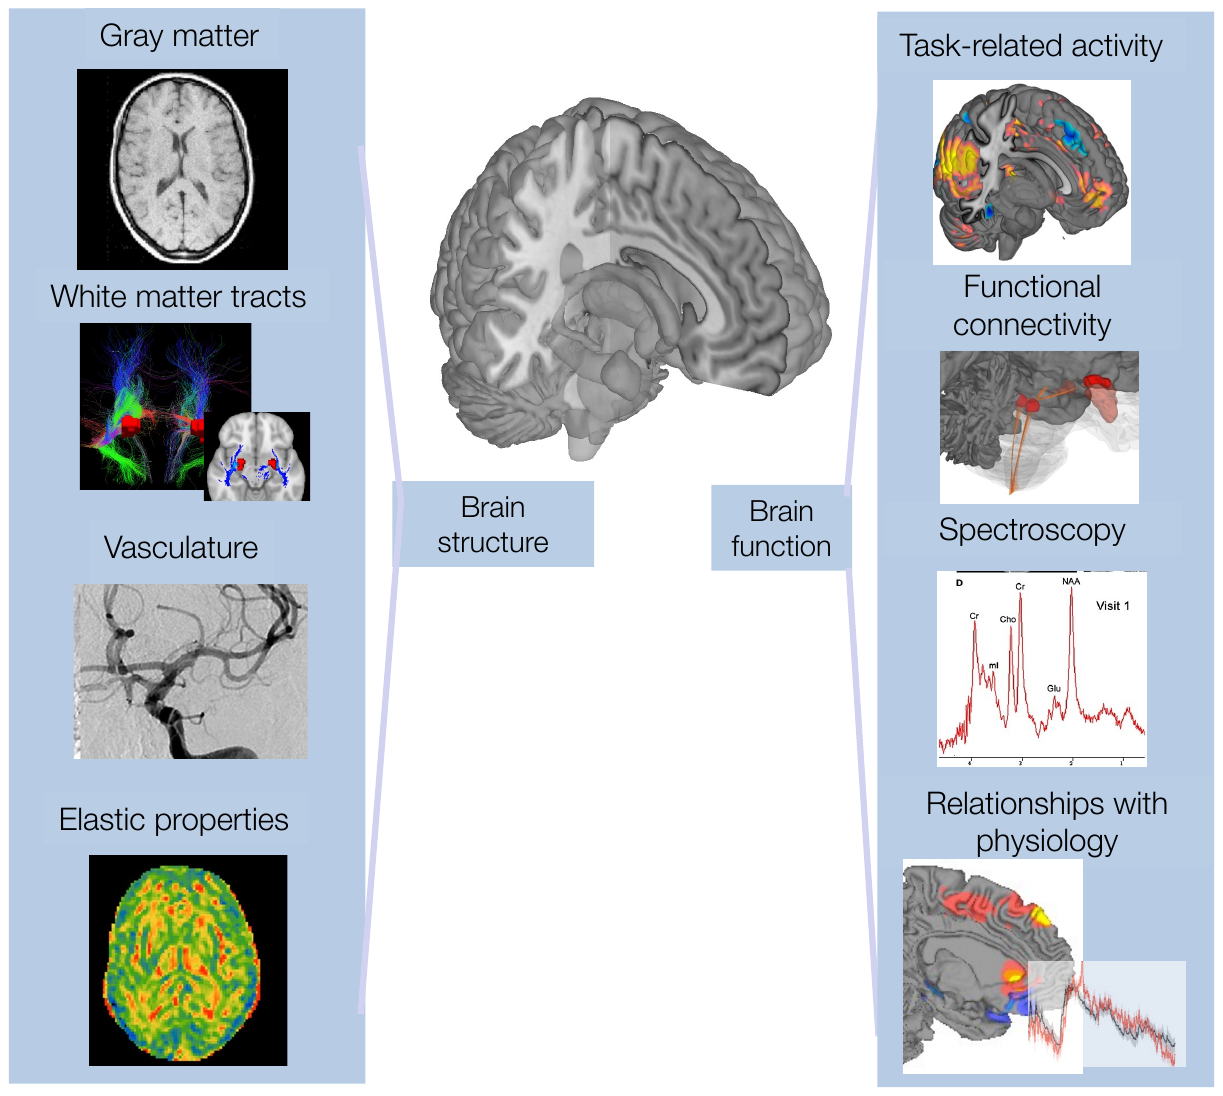
One scanner, many types of images. MRI provides structural (left) and functional (right) measures of the brain, offering multiple windows onto the relationships between brain, mind, body, and health. (Figure 1.2 from the book. © the authors and MIT Press; reproduced with permission — not covered by this site’s CC-BY license.)
The field earned its maturity the hard way. In fMRI’s heady early years, observing activity during memory retrieval was taken as the “neural basis” of memory; amygdala activity was read as unconscious threat; “pain area” activation during social rejection meant rejection literally hurt; and strong correlations (e.g., r = 0.9) were assumed to be practically meaningful. Each of these reflects a logical error or unaccounted statistical bias, and a wave of exposé-style papers on effect sizes, statistical power, reproducibility, and false positives shook researchers’ and journalists’ faith — prompting healthy self-correction. These problems are not unique to neuroimaging; they pervade genetics, animal models, psychology, and beyond. The chapters ahead give you the conceptual tools to ask the right questions — to tell findings that are robust and credible from those that are too good to be true.
A first taste of the tools
This book’s tutorials come in two flavors: MATLAB, using the CANlab object-oriented tools (built on SPM), and Python, using the nilearn/numpy scientific stack. Before diving into later chapters’ full labs, here is the “hello, world” of each ecosystem — loading a brain image and displaying it. Installation instructions are on the setup page; you can also simply read the code for now and run it later.
% Requires CanlabCore + SPM12 on your MATLAB path — see the setup page
% Adapted from CANlab tutorials (github.com/canlab/CANlab_help_examples)

% Load a bundled sample dataset: contrast images from 30 participants
% in an emotion regulation study (Wager et al. 2008, Neuron).
% load_image_set reads the images into an fmri_data object -- the basic
% CANlab container storing image data as a [voxels x images] matrix.
[data_obj, subject_names, image_names] = load_image_set('emotionreg');   % 'emotionreg' = keyword for the bundled 30-subject dataset

data_obj              % display a summary of the object

% One command produces a suite of diagnostic plots: mean image,
% histograms, covariance across images, and outlier metrics
plot(data_obj)
# Requires nilearn (pip install nilearn) — see the setup page
from nilearn.datasets import load_mni152_template
from nilearn.plotting import plot_anat
import matplotlib.pyplot as plt
# Load the MNI152 standard-space anatomical template (bundled with nilearn)
template = load_mni152_template(resolution=2) # resolution = voxel size in mm (2 = 2-mm isotropic voxels)
print(template.shape) # 3D grid of voxels (x, y, z)
print(template.header.get_zooms()) # voxel size in mm along each axis
# Display orthogonal slices through the volume
plot_anat(template, title="MNI152 template",
display_mode="ortho") # ortho = sagittal + coronal + axial views
plt.show()Example output: running the Python tab prints the template’s dimensions and voxel size, then displays orthogonal slices:
(99, 117, 95)
(np.float32(2.0), np.float32(2.0), np.float32(2.0))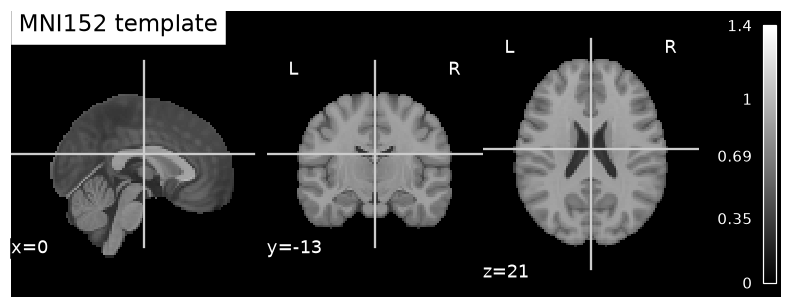
Orthogonal views of the MNI152 standard-space template — a 99 × 117 × 95 grid of 2-mm voxels. The MATLAB tab’s plot(data_obj) produces an analogous multi-panel summary of the loaded dataset.
Both snippets illustrate the same idea: a brain image is just structured data — a 3D (or 4D) array plus spatial metadata — wrapped in an object that knows how to summarize and display itself. Everything in this book builds on that foundation.
Thought questions
The chapter attributes fMRI’s dominance to scientific, economic, and social factors. Suppose the creators of SPM, FSL, and AFNI had sold their software commercially instead of releasing it freely. Which specific developments in the field’s history — methodological, empirical, or cultural — do you think would have unfolded differently, and would fMRI still have become the tool of choice across disciplines?
Large prospective datasets like UK Biobank and ABCD were designed for sharing from the outset, whereas repositories like OpenNeuro aggregate investigator-led studies designed for specific hypotheses. What complementary strengths and weaknesses do these two models of open data have for answering questions about brain–behavior relationships? What kinds of questions can each answer that the other cannot?
BOLD signal is unitless and drifts over minutes, while ASL yields absolute blood flow values stable across months — yet over 99% of fMRI studies use BOLD. What scientific and practical considerations might explain this dominance, and for what research questions would you insist on ASL (or spectroscopy) instead?
The early inferential errors described in the chapter — e.g., inferring that social rejection “hurts like physical pain” from overlapping activation — were made by capable scientists and amplified by journalists. What features of neuroimaging data make such errors especially tempting, and what norms or practices from the open-science movement could serve as structural safeguards against their recurrence?
fMRI sits between EEG (cheaper, faster, electrically direct) and PET (neurochemically specific) on several dimensions. Imagine funding agencies could subsidize only one modality’s infrastructure for the next decade. Drawing on the chapter’s comparison of resolution, coverage, cost, safety regulation, and repeatability, make the case for and against choosing fMRI.
Quiz yourself
Q1. Roughly how many neurons does the human neocortex contain, and how many connections does each make?
Answer: On the order of 20 billion neurons, each making on average 5,000–10,000 connections with other cells — alongside roughly 30 billion glial cells that also participate in information processing.
Q2. What are the three major open-source software packages for fMRI analysis?
Answer: SPM (Statistical Parametric Mapping), FSL (the fMRIB Software Library), and AFNI (Analysis of Functional Neuroimages). All three were made open-source and freely available early on, and each is supported by an active community contributing extensions and pipelines.
Q3. What spatial and temporal resolution does fMRI typically offer?
Answer: Whole-brain coverage about every second at roughly 2 mm spatial resolution, or about every 200 msec at lower spatial resolution. With clever experimental designs, psychological events as little as ~100 msec apart can be discriminated, though fMRI remains far less temporally precise than EEG or MEG.
Q4. How does fMRI compare with PET and EEG in cost and regulation?
Answer: fMRI is roughly three times less expensive than PET but about an order of magnitude more costly than EEG. Because it requires no injection of radioactive tracers, it is less regulated than PET, making it accessible to behavioral and health researchers without medical oversight or radiation safety approvals.
Q5. Name three large-scale open neuroimaging datasets and their target populations.
Answer: Examples include UK Biobank (100,000 UK adults planned, population health), ABCD (over 10,000 US adolescents, longitudinal development), the Human Connectome Project (1,200 healthy adults), ABIDE (autism), ADNI (Alzheimer’s disease), and PPMI (Parkinson’s disease).
Q6. What is BOLD signal, and what fraction of fMRI studies use it?
Answer: Blood Oxygen Level-Dependent signal — contrast reflecting a mix of local blood flow and oxygenation, which in turn tracks metabolic demand. It underlies over 99% of studies reporting fMRI “activity” or “activation.”
Q7. How does arterial spin labeling (ASL) differ from BOLD imaging?
Answer: ASL provides quantitative measures of cerebral blood flow in absolute physiological units (mL/min) that can remain stable across months, whereas BOLD signal has no direct, stable physiological units and drifts substantially over minutes. ASL therefore permits direct comparisons of blood flow across mental states or time points.
Q8. Give two examples of early inferential errors in fMRI research described in the chapter.
Answer: Examples include: assuming observed activity during a task is that task’s “neural basis” or mechanism; interpreting amygdala activity as unconscious threat; concluding social rejection “hurts like physical pain” because it activates “pain areas”; treating a brain–behavior correlation as showing the region is the basis of the behavior; and taking very strong observed correlations (e.g., r = 0.9) as practically meaningful without accounting for statistical bias.
 The book: Elements of Functional Magnetic Resonance Imaging — Wager & Lindquist, MIT Press