Types of Neuroimaging
Overview
No single instrument can see everything the brain does. Functional neuroimaging techniques form a family of complementary tools, each sensitive to a different physiological trace of neural activity. The magnetic resonance family includes Blood Oxygen Level Dependent (BOLD) fMRI, Arterial Spin Labeling (ASL), and MR spectroscopy (MRS), all of which exploit magnetic resonance to create contrast across tissues, molecules, or levels of blood flow and oxygenation. Radiotracer techniques — Positron Emission Tomography (PET) and Single-Photon Emission Computerized Tomography (SPECT) — image the fate of radioactively labeled compounds injected into the bloodstream. Scalp recording techniques — electroencephalography (EEG), magnetoencephalography (MEG), and functional near-infrared spectroscopy (fNIRS) — sense electrical, magnetic, or optical signals from outside the head, and functional ultrasound (fUS) is an emerging acoustic approach. These noninvasive methods complement invasive ones that require penetrating or removing the skull, such as electrocorticography (ECoG) and intracranial EEG. Each technique offers its own unique perspective on brain function, with its own strengths and weaknesses.
Several dimensions organize the comparison: (a) which underlying brain processes a technique is sensitive to; (b) its spatial resolution; (c) its temporal resolution and stability; (d) its coverage and sensitivity across brain structures; (e) whether it involves radioactivity and can be safely repeated; and (f) its cost-effectiveness and ease of adoption by a broad community. A subtle but important idea is that resolution has both lower and upper bounds. The lower bound of spatial resolution — how small a functional unit can be and still yield information — depends on the technique’s inherent resolution and signal-to-noise ratio, and for group analyses on functional anatomical variability across people; the upper bound is set by brain coverage, since some techniques measure only one or a few isolated regions. Likewise, the lower bound of temporal resolution depends on sampling rate and on the physiology being imaged (electrical activity changes millisecond by millisecond; hemodynamics unfold over seconds), while the upper bound depends on whether the measure is stable enough to capture meaningful variation across minutes, days, or months. fMRI is popular among whole-brain techniques largely because it strikes a good balance across all of these considerations.
Within the MR family, BOLD imaging — first demonstrated by Seiji Ogawa in 1990 and now used in over 99% of published fMRI activation studies — measures a complex signal reflecting a mix of blood oxygenation and cerebral blood flow (CBF), which is in turn driven by the metabolic demands of neuronal and glial activity. It is not a pure measure of neuronal excitation or inhibition, though it typically tracks increases in postsynaptic input and local field potentials. Modern pulse sequences can acquire a whole-brain BOLD image in under 500 msec with voxels under 3 mm, and BOLD requires no injections or contrast agents. Its central limitation is that it is not quantitative: it measures relative activity in arbitrary “BOLD units” that vary across scanners, sessions, and even drift within a scan. BOLD is therefore best suited to stimulus- and task-evoked responses on short time scales (optimally 10–30 seconds) — it can detect responses to stimuli presented for less than 35 msec, peaking about 5–6 seconds later — but it is a poor choice for imaging slowly evolving states like drug effects or mood, unless those states are probed via their effects on evoked responses or functional connectivity. ASL fills exactly this gap: by magnetically labeling blood in the neck and reading the label out as blood flows into the brain, it yields a quantitative measure of CBF that is stable even across months, at the cost of slower imaging (~8 seconds per whole-brain image) and roughly one-tenth the signal magnitude of BOLD. MRS, meanwhile, trades coverage for chemistry: from a single large voxel (~20 mm across, often requiring 10–15 minutes of acquisition) it resolves spectral peaks for molecules such as N-acetylaspartate (a marker of neuronal health), the glutamate–glutamine complex (Glx), and — with specialized sequences or higher fields — the inhibitory transmitter GABA.
The radiotracer techniques offer something MRI largely cannot: molecular specificity across hundreds of targets. PET attaches a radioisotope (commonly [11-C], [15-O], or [18-F]) to a molecule of interest; as the tracer decays, emitted positrons annihilate with electrons, producing photon pairs that a detector ring reconstructs into a 3-D image. PET can quantify blood flow, glucose metabolism, and — its unique strength — receptor binding for neurotransmitters, neuropeptides, and inflammatory markers, with “activation” of a transmitter system measured as a drop in binding during a task. The costs are substantial: tracers must be synthesized on-site in a cyclotron minutes before scanning, effective spatial resolution is around 15 mm, images take 10–40 minutes to acquire (precluding event-related and connectivity analyses), and radioactivity limits how often a person can be scanned. SPECT, the oldest whole-brain metabolic technique (1963), uses single-photon tracers and a rotating camera; its markedly lower resolution has limited its use in research.
The scalp electromagnetic techniques invert the trade-off: exquisite timing, uncertain location. EEG (dating to 1924) detects electrical potentials at the scalp generated when populations of pyramidal neurons — aligned in parallel in the cortical sheet — depolarize together, forming dipoles between deep cell bodies and superficial dendrites. It offers millisecond resolution, low cost, and portability (researchers have equipped entire classrooms, and carried systems into the Himalayas), but the scalp conducts and smears potentials, making source localization an ill-posed inverse problem, and coverage of deep structures is poor. EEG is most sensitive to cortical gyri; MEG, its younger cousin (1968), detects the magnetic fields perpendicular to those same dipoles with superconducting SQUID magnetometers and is instead most sensitive to sulci. Because the skull does not distort magnetic fields, MEG localizes sources more precisely than EEG, but scanners are expensive and scarce — though wearable helmets using optically pumped magnetometers, first demonstrated in 2017, may transform its accessibility. fNIRS shines near-infrared light through the scalp and skull and reads the reflected spectrum to estimate concentrations of oxygenated and deoxygenated hemoglobin — a hemodynamic signal much like BOLD, cheap and portable but limited to roughly the outer 1.5 cm of tissue. Functional ultrasound, the newest entrant, images microvascular dynamics via Doppler shifts with remarkable spatiotemporal resolution (~200 micrometers) but currently penetrates only about 2 cm, making it especially promising for rodent imaging.
Table 1:A field guide to noninvasive functional neuroimaging techniques
Technique | What it measures | Spatial resolution / coverage | Temporal resolution | Cost & accessibility |
|---|---|---|---|---|
BOLD fMRI | Blood oxygenation + flow (relative, non-quantitative) | mm-scale (sub-mm at best); whole brain, with dropout near air-tissue boundaries | Seconds (hemodynamic lag ~5–6 s); whole-brain volumes in <500 msec | Moderate; widely available |
ASL fMRI | Cerebral blood flow (quantitative) | mm-scale; whole brain | ~8 s per image; stable across months | Moderate; growing with commercial sequences |
MRS | Concentrations of specific molecules (NAA, Glx, GABA, …) | Single large voxel (~20 mm); limited coverage | Minutes per measurement | Moderate; needs specialized sequences |
PET | Blood flow, glucose metabolism, receptor binding (hundreds of tracers) | ~15 mm effective; whole brain, minimal distortion | 10–40 min per image (20–30 s at best) | High cost; cyclotron + radiochemistry required; radioactivity limits repeats |
SPECT | Metabolism, neurochemistry (single-photon tracers) | Lower than PET; whole brain | Slow | Lower cost than PET; limited research use |
EEG | Electrical potentials from synchronized pyramidal neurons (gyri-dominant) | cm-scale; source localization ill-posed; poor for deep structures | Milliseconds | Inexpensive, portable, scalable |
MEG | Magnetic fields from cortical dipoles (sulci-dominant) | Better than EEG; still limited in depth | Milliseconds | Expensive and scarce; wearable OPM systems emerging |
fNIRS | Oxy-/deoxyhemoglobin via near-infrared light | Outer ~1.5 cm of cortex only | Seconds (hemodynamically limited) | Inexpensive, safe, portable |
fUS | Microvascular blood volume via Doppler ultrasound | ~200 μm; penetrates ~2 cm | Milliseconds-scale imaging rates | Emerging; few human applications yet |
Because PET and fMRI are the two leading options for whole-brain functional imaging, the chapter compares them directly in five domains. Acquisition and fidelity: MRI can be repeated on the same person indefinitely, enabling longitudinal designs, large multisite studies, and “deep phenotyping,” and a single MRI session can collect structural, diffusion, vascular, functional, and spectroscopic images; PET’s radioactivity precludes frequent repetition, but its images are free of the susceptibility artifacts — signal loss and distortion near the amygdala, inferior temporal lobes, and orbitofrontal cortex — that are intrinsic to BOLD. Signal interpretability: PET provides purer, more interpretable measures of blood flow and glucose metabolism, whereas BOLD is a complex mixture; but fMRI can link activity to events unfolding over seconds, powering event-related and connectivity analyses, while PET needs 20–30 seconds minimum (often 10–40 minutes) per image. Resolution: fMRI wins on both axes — sub-millimeter spatial resolution at the high end, and event-related averaging that can resolve timing differences of roughly 100–200 msec despite the sluggish hemodynamic response. Accessibility: fMRI costs about one-third as much as PET, faces less regulatory burden, and rides on an installed base of MRI scanners in hospitals and psychology departments; critically, its major analysis packages (SPM, FSL, AFNI) are open source, and its culture of data sharing has opened the field to statisticians and computer scientists. Multimodal potential: both combine with other techniques, and simultaneous EEG–fMRI is powerful, but PET is technically simpler to pair with other devices because it lacks a strong magnetic field. Where PET remains unmatched is molecular imaging — a capability that has proven critical for drug development and early Alzheimer’s diagnosis.
Although this book focuses on fMRI analysis, the choice of technique should always follow the scientific question: millisecond dynamics call for EEG or MEG, receptor systems call for PET, stable baseline states favor ASL, and field studies favor EEG or fNIRS. And happily, most of the analysis principles developed in the chapters ahead — modeling, inference, prediction — transfer to every one of these data types.
Key ideas in pictures
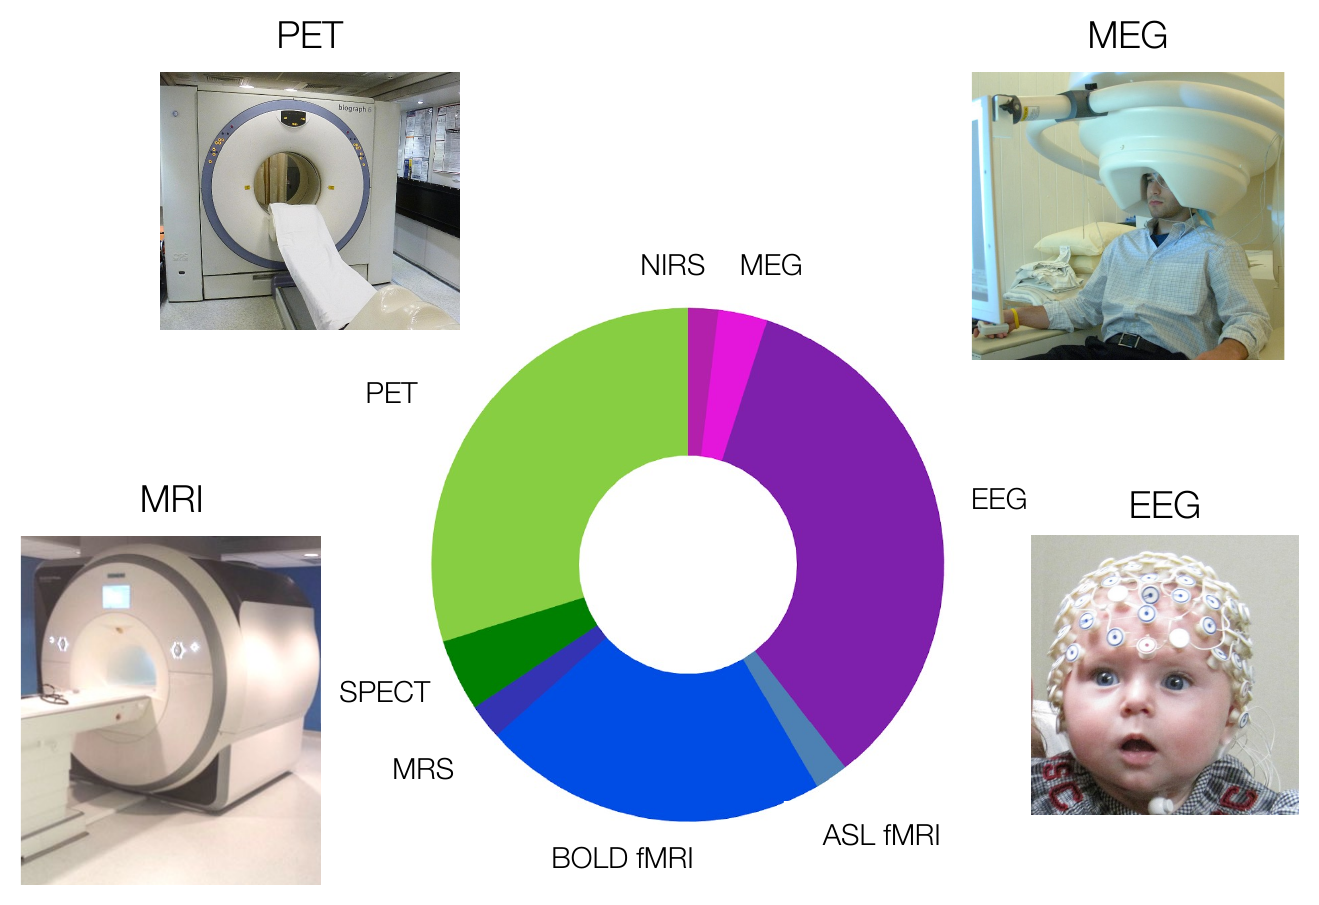
Major functional neuroimaging techniques and their relative popularity in the scientific literature since 2010. MRI-based techniques (blues) include BOLD fMRI, ASL, and MRS; radiotracer techniques (greens) include PET and SPECT; scalp recording techniques (purples/pinks) include EEG, MEG, and NIRS. BOLD fMRI and EEG have grown in popularity, while SPECT and MRS have declined. (Figure 4.1 from the book. © the authors and MIT Press; reproduced with permission — not covered by this site’s CC-BY license.)
Three signal families. Every noninvasive technique reads out one of three physical traces of brain activity — electromagnetic fields, hemodynamics/metabolism, or molecular binding — and the trace it reads determines its characteristic strengths.
What fMRI and PET can each see. The two leading whole-brain techniques divide the territory: MR methods dominate dynamic activity and a handful of molecules; PET’s radiotracers reach hundreds of molecular targets.
Table 2:Summary of fMRI and PET measures (adapted from Table 4.1 in the book)
Measure | fMRI | PET |
|---|---|---|
Overall activity / metabolism | BOLD signal (T2*); blood flow via arterial spin labeling (ASL) | Blood flow: [15-O]-PET; glucose metabolism: [18-F]FDG |
Molecular properties / activity | Selected compounds via MR spectroscopy: N-acetylaspartate (NAA), choline, creatine, alanine, lactate, myoinositol, glutamate + glutamine and GABA (Glx), glucose | Several hundred tracers for neurotransmitters, neuropeptides, and inflammatory markers — e.g., [11-C]raclopride (dopamine D2), [11-C]carfentanil (mu-opioid), [carbonyl-11-C]WAY100635 (serotonin 1A), [11-C]PIB (amyloid), TSPO ligands (microglial activation) |
The fMRI-vs-PET scorecard. Neither technique dominates; the balance of advantages depends on the question.
Thought questions
The chapter argues that fMRI’s dominance stems not from being best on any single dimension but from a favorable balance — plus open-source software and data sharing. Imagine a counterfactual history in which PET analysis software had been free and MRI packages proprietary. How much of today’s methodological landscape (event-related designs, connectivity analysis, large shared datasets, machine-learning approaches) would look different, and what does that imply about how sociological factors shape which scientific questions get asked?
BOLD measures relative signal in arbitrary units that drift within a scan and vary across scanners, yet it underlies the vast majority of published fMRI studies. For each of these research goals — a biomarker of chronic pain severity, a study of drug effects on baseline brain state, a study of the timing of decision-making, and a longitudinal study of adolescent development — decide whether BOLD, ASL, or another technique is best suited, and identify exactly which property of the signal drives your choice.
EEG is most sensitive to dipoles in cortical gyri, MEG to those in sulci, BOLD to hemodynamics everywhere but with dropout near air–tissue boundaries, and fNIRS only to the outer 1.5 cm of cortex. Suppose two techniques disagree about whether a region is “active” during a task. Work through how each technique’s coverage and sensitivity profile could produce this disagreement without either measurement being wrong — and what this implies for interpreting null results in any single modality.
PET requires an on-site cyclotron, regulatory approval per tracer per site, and exposes participants to radioactivity — yet it remains irreplaceable for molecular imaging and dominant in drug development. Wearable MEG and fUS are described as potentially transformative but immature. If you directed a national funding agency, how would you allocate investment between improving the dominant, accessible technique (fMRI) and maturing niche techniques with unique capabilities? What criteria beyond publication counts should guide that decision?
The chapter notes that the effective resolution of a technique depends on the analysis as well as the modality — for example, fMRI signal is unstable across minutes, yet task-evoked activation and connectivity can be stable across months. What does this distinction between “raw signal stability” and “derived measure stability” mean for building trait-like neuromarkers (Chapter 3), and how should a researcher decide at which level of derived measure their question lives?
Quiz yourself
Q1. What are the three main MR-based functional imaging techniques, and what does each measure?
Answer: BOLD fMRI measures a complex, relative signal reflecting blood oxygenation and cerebral blood flow; ASL measures quantitative cerebral blood flow by magnetically labeling blood in the neck; and MR spectroscopy measures concentrations of specific molecules (such as NAA, Glx, and GABA) from a large voxel of tissue.
Q2. Why is BOLD said to be “non-quantitative,” and what practical limitation does this create?
Answer: BOLD measures relative activity in arbitrary units that vary across scanners, hardware, and sessions, and drift over time within a scan — it does not measure the absolute level of any physiological parameter. As a result, BOLD is best for detecting task-evoked changes over short time scales (optimally 10–30 s) and poorly suited to imaging slowly evolving states like drug effects or mood.
Q3. How does PET produce an image, and what is its unique strength?
Answer: A radioisotope (e.g., [11-C], [15-O], [18-F]) is attached to a molecule of interest and injected; positrons from tracer decay annihilate with electrons, emitting photon pairs detected by a ring of detectors and reconstructed into a 3-D image. PET’s unique strength is molecular imaging — several hundred tracers can target specific neurotransmitter, neuropeptide, and inflammatory systems.
Q4. Why is EEG most sensitive to cortical gyri while MEG is most sensitive to sulci?
Answer: Synchronized pyramidal neurons create electrical dipoles perpendicular to the cortical sheet. EEG detects the electrical potentials, which are strongest for dipoles oriented perpendicular to the skull — i.e., in gyri. MEG detects the magnetic fields, which run perpendicular to the dipoles, so it picks up dipoles oriented along the skull surface — i.e., in sulci.
Q5. What sets the lower and upper bounds of a technique’s temporal resolution?
Answer: The lower bound is set by the sampling rate and by the physiology being imaged — electrical signals change on a millisecond scale, hemodynamic signals over seconds. The upper bound is set by the measure’s stability across time: whether meaningful variation can be captured across minutes, days, or months (e.g., ASL is stable across months; raw BOLD signal is not).
Q6. Give two advantages of PET over BOLD fMRI and two advantages of fMRI over PET.
Answer: PET advantages: it is free of susceptibility artifacts (clean coverage of the amygdala, orbitofrontal, and inferior temporal cortex) and provides pure, quantitative measures of blood flow or glucose metabolism — plus molecular imaging. fMRI advantages: it can be safely repeated (enabling longitudinal and deep-phenotyping designs) and has far better spatial and temporal resolution, enabling event-related and connectivity analyses; it is also about one-third the cost.
Q7. What is fNIRS, and what are its main advantages and limitations?
Answer: Functional near-infrared spectroscopy shines near-infrared light through the scalp and skull and measures the reflected spectrum to estimate oxygenated and deoxygenated hemoglobin concentrations — a hemodynamic signal similar to BOLD. It is safe, inexpensive, and portable, but its temporal resolution is hemodynamically limited, it covers only tissue within about 1.5 cm of the surface, and its signal-to-noise ratio can be lower than other techniques.
Q8. Beyond the physics, what community factors helped fMRI become the dominant functional imaging technique?
Answer: The major fMRI analysis packages (SPM, FSL, AFNI) were released as free, open-source software, and the field embraced large-scale data sharing — repositories with 1,000+ participants. Combined with the wide availability of MRI scanners and lower cost (~1/3 of PET), this drew a broad, multidisciplinary community of researchers, including statisticians and computer scientists.
 The book: Elements of Functional Magnetic Resonance Imaging — Wager & Lindquist, MIT Press