Contrasting Statistical Mapping with Traditional Neuroradiology
Overview
Traditionally, interpreting medical images has been the province of expert opinion. Neuroradiologists are highly trained to recognize features in brain images and relate them to known diseases: a bright or dark area may be read as a tumor, a stroke, an aneurysm, or a harmless normal variant. In this workflow, the imaging technology’s job is to deliver a picture with the right contrast — essentially, a picture of the data — and the expert supplies the interpretation. This model has saved countless lives. Detection of strokes, tumors, aneurysms, and hydrocephalus is immediately actionable, often with surgery or drugs, and these successes form the foundation of neuroradiology and neurosurgery. But they rest on a relatively small set of conditions in which pathology is visible to the naked eye. Much is missed: subtle patterns no eye can detect, structural variants that matter but are not immediately life-threatening, and information distributed too widely across the image for any human to integrate.
Modern MRI actually delivers a wealth of quantitative information — gray-matter density from T1 and T2 images, white-matter tract integrity from diffusion MRI, vascular structure from angiography, neurochemical concentrations from spectroscopy, perfusion and task-evoked activity from functional MRI. Yet only a small fraction of this information is currently visible by eye and clinically actionable. Remarkably, the only widely accepted clinical application of fMRI is presurgical mapping: localizing gross functions like vision, language, and somatosensation so that surgeons can spare tissue whose removal would cause severe deficits. Diagnoses based on how people’s brains respond to tasks — the main subject of functional MRI — are almost entirely absent from the clinician’s toolbox.
Expert judgment also carries costs that are easy to underestimate. Diagnostic errors from medical images exceed 20% across a wide range of diseases, and 50% for some; radiology has among the highest rates of malpractice suits, roughly half related to image misinterpretation. Diagnoses that lean on clinical impressions and patient self-report can be unreliable in a deeper sense: in the DSM-5 field trials, if one clinician diagnosed depression, a second clinician had only about a 50% chance of agreeing. Unreliable diagnoses are “moving targets” that make treatments hard to develop and test. And in a minority of cases, the subjectivity of expert authority is actively exploited — from pseudoscientific “miracle cures” to forensic disciplines like bite-mark and handwriting analysis, where confident subjective testimony with low predictive validity has done real harm. A core tenet of the scientific method pushes the other way: truth should rest on quantitative evidence that is repeatable and available to all, not on the pronouncements of authorities.
Statistical brain mapping is qualitatively different from the traditional approach. It has more in common with quantitative biomarkers from blood panels or genetics, and with machine-learning prediction in business and engineering, than with visual image reading: inferences about which regions are activated by a task or altered in disease come from statistical models fit across many people, not from one person’s perceptual judgment. Importantly, in most successful applications elsewhere in society, quantitative models do not replace experts — they hand experts high-level summaries of data too complex to interpret raw. Meteorologists do not forecast from raw climate data; physicians do not eyeball raw blood-assay output, but read scores quantified against population norms. Humans still make the decisions. The models make the decisions better informed.
The contrast becomes vivid with a single case. Consider the T1 image of a 77-year-old man shown below. One expert read it as showing “ventricular enlargement” and “white-matter hyperintensities” — no actionable diagnosis. A second, reviewing the same images independently, saw “markedly severe focal bilateral parietal atrophy, and focal bimesiotemporal atrophy... entirely consistent with the pattern of atrophy seen in Alzheimer’s Disease.” Neither read answered the questions that matter quantitatively: How typical is this image for a healthy person of this age? How well does it match the atrophy pattern of Alzheimer’s disease? Given the image, how likely is Alzheimer’s? The brain-mapping approach would treat the same image entirely differently — comparing it statistically to large databases of healthy age-matched controls and of patients with a range of dementias, integrating information across the entire image, and returning probability scores for each disorder. This is not yet standard practice, but neither is it a pipe dream: quantitative models built on thousands of individuals already track gray-matter change with aging reliably enough to predict a person’s chronological age from a single structural image with correlations of r = 0.8–0.95 — something no radiologist could do by eye, because the information is too distributed and the mapping too complex. Prognostic biomarkers now predict conversion to Alzheimer’s with useful accuracy (for example, 87% specificity and 71% sensitivity for one amyloid-PET marker, and 80–90% positive predictive value for recent models combining connectivity, structure, and cognition). That such models are not yet in routine clinical use reflects, in large part, a cultural gap between medical imaging and brain-mapping science that will take time — and trust — to close.
The history of brain mapping itself mirrors this evolution. Early work — call it Cognitive Neuroscience 1.0 — tested activity one voxel at a time, contrasting experimental tasks against control tasks and assuming that activated areas were involved in the mental process of interest (“face areas,” “pain areas”). Its goal was group-level mapping: establishing which regions are activated by which tasks across a population, without asking about diagnostic accuracy for individual people. This foundation taught us a great deal about how the brain is organized into systems — for instance, reliable associations between response inhibition and fronto-subcortical activation — but by itself it licenses only weak inferences about individuals. The positive predictive value of low prefrontal activation for cognitive impairment, P(impairment | activation), has simply not been established. (Ironically, structural MRI is already used in court — reduced prefrontal gray matter has been offered to argue for reduced culpability in murder sentencing — even though its predictive value for behavioral control is equally unquantified. Which brain evidence we trust remains largely a matter of historical belief rather than quantitative analysis.)
Over the past decade, a Cognitive Neuroscience 2.0 has emerged to fill these gaps. It develops and validates quantitative models that make predictions about individual people from brain data — typically using pattern-recognition (machine-learning) algorithms that integrate signals distributed across many regions, and testing sensitivity, specificity, and generalizability in new samples and increasingly diverse cohorts. Brain-age estimation and image-based prediction of conversion to Alzheimer’s are two examples among many. The same paradigm is spreading across medicine: one system trained on 470,388 chest X-rays flagged “critical” findings for priority radiologist review with a 61% positive and 95% negative predictive value; simulations showed it would cut the average wait for expert review of critical films from 11.2 days to 2.7. That is the template for the future this chapter argues for — not algorithms instead of experts, but statistical models and human expertise combined to improve on what either can do alone.
Key ideas in pictures
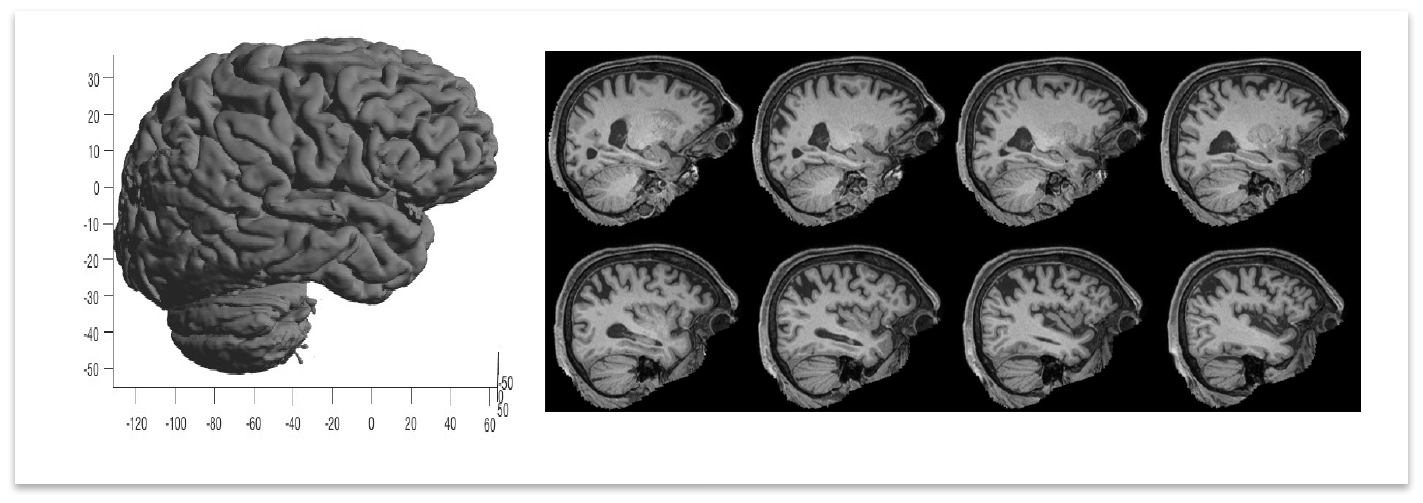
Two ways of seeing one brain. A T1 MRI image from a 77-year-old man: a rendered cortical surface and sagittal slices. A neuroradiologist would interpret these pictures by eye — and two experts reading this very case reached different conclusions, neither with a quantitative estimate of disease likelihood. A statistical brain-mapping approach would instead compare the image against databases of healthy age-matched controls and patients with various dementias, returning probability scores for each diagnosis. The two approaches could be merged, potentially to great clinical benefit. (Figure 9.1 from the book. © the authors and MIT Press; reproduced with permission — not covered by this site’s CC-BY license.)
Two paradigms, side by side. The traditional and statistical approaches differ in what they take as input, who or what does the inference, and what kind of output they produce.
| Traditional neuroradiology | Statistical brain mapping | |
|---|---|---|
| Role of the image | A picture of the data, delivered with the right contrast for viewing | A quantitative dataset — hundreds of thousands of voxel values |
| Who/what interprets | A trained expert’s perceptual judgment | A statistical model fit across many individuals |
| Information used | Features visible to the naked eye (one or two salient findings) | Information integrated across the entire image, including patterns invisible to the eye |
| Reference standard | The expert’s training and experience | Explicit databases of healthy controls and patient groups |
| Typical output | A qualitative read (“ventricular enlargement”); sometimes a diagnosis | Quantitative scores: probabilities, predictions, population percentiles |
| Reliability | Varies between experts; diagnostic error >20% across many diseases | Repeatable: the same model gives the same answer for the same data |
| Where it excels | Visible, immediately actionable pathology — strokes, tumors, aneurysms, hydrocephalus | Distributed, subtle patterns — brain age, atrophy patterns, disease risk scores |
| Chief limitation | Misses information not visible by eye; subject to bias and inter-expert disagreement | Needs large validated databases, standardization, and clinical trust — still maturing |
| Closest relatives | Expert reads elsewhere in medicine, law, and forensics | Blood-panel biomarkers, genetic risk scores, machine-learning prediction |
From group maps to individual prediction. Brain mapping’s own history recapitulates the shift from qualitative description toward quantitative, decision-relevant models.
The chest X-ray triage system described above is one working instance of the final node: the model flags likely-critical films so that expert review of them happens in 2.7 days on average instead of 11.2 — the radiologists, not the model, still make every diagnosis.
Thought questions
Two experts read the same T1 image from a 77-year-old man: one saw only “ventricular enlargement,” the other a pattern “entirely consistent with Alzheimer’s Disease.” Diagnose the disagreement itself: which properties of expert visual interpretation (information access, context effects, reliability) most plausibly produced it, and which of the chapter’s three unanswered quantitative questions would have most changed the clinical picture had a model been available to answer it?
Quantitative models can predict chronological age from a structural MRI with r = 0.8–0.95, yet no radiologist could “read” age from the same scan. What does this asymmetry reveal about the kinds of information that raw images contain versus the kinds that human perception can extract — and does it imply that every expert-read modality in medicine leaves comparable information on the table?
Courts already accept reduced prefrontal gray matter as evidence bearing on culpability in sentencing, while remaining skeptical of functional activation evidence — yet the chapter notes that the positive predictive value of neither has been quantified. Construct the strongest argument that this differential trust is defensible, and the strongest argument that it is merely historical accident. What evidence would resolve the question?
The chest X-ray triage system had a positive predictive value of 61% and a negative predictive value of 95% for “critical” findings. Argue for and against deploying it: in what specific ways does a 39% false-positive rate among flagged films matter (or not) when the system prioritizes rather than replaces expert review? How would your analysis change if the system instead issued final diagnoses?
The chapter attributes the slow clinical adoption of validated neuroimaging biomarkers partly to a “difference in culture” between medical imaging and brain-mapping science. Drawing on the meteorology and blood-panel analogies, sketch what a mature merged culture would look like in a neurology clinic: what would radiologists do differently, what infrastructure (databases, norms, standards) would be required, and what could go wrong during the transition?
Quiz yourself
Q1. In traditional neuroradiology, what is the role of the imaging technology and what is the role of the expert?
Answer: The technology’s job is to deliver an image with the appropriate contrast — essentially a picture of the data — and the expert interprets it, using trained perception to recognize features such as tumors, strokes, aneurysms, or normal variants.
Q2. For which kinds of conditions has the expert-read approach been most successful, and why?
Answer: Conditions whose pathology is visible to the naked eye and immediately actionable — strokes, tumors, aneurysms, hydrocephalus — which can often be treated promptly with surgery or drugs. These successes founded neuroradiology and neurosurgery, but they cover a relatively small number of conditions.
Q3. What is currently the only commonly accepted clinical application of fMRI?
Answer: Neurosurgical (presurgical) mapping: localizing gross functions such as vision, language, and somatosensory processing so surgeons can avoid removing tissue whose loss would cause severe functional deficits.
Q4. How common are diagnostic errors based on medical images, and how reliable are expert psychiatric diagnoses such as depression?
Answer: Image-based diagnostic error exceeds 20% across a wide range of diseases and 50% in some. In the DSM-5 field trials, inter-clinician reliability for depression was so low that if one clinician made the diagnosis, another had only about a 50% chance of agreeing — and other mental-health diagnoses are similarly unreliable.
Q5. What does statistical brain mapping have in common with blood-panel biomarkers, and how does this differ from an expert read?
Answer: Like blood panels, brain mapping quantifies raw measurements, compares them against population norms, and aggregates them into scores (e.g., disease probabilities) that experts use in decision-making. The inference comes from a repeatable statistical model fit across many people, not from one individual’s perceptual judgment of raw data.
Q6. What three quantitative questions did the clinical reads of the 77-year-old man’s T1 image fail to answer?
Answer: (1) How typical is this image for healthy individuals of comparable age? (2) How well does it match the pattern of atrophy seen in Alzheimer’s disease? (3) How likely is it that the person has Alzheimer’s, given these images? A statistical approach compares the image to control and patient databases to answer exactly these questions.
Q7. What distinguishes “Cognitive Neuroscience 1.0” from “Cognitive Neuroscience 2.0”?
Answer: CN 1.0 mapped task-evoked activity one voxel at a time at the group level, asking which areas activate for which tasks, without assessing diagnostic value for individuals. CN 2.0 builds and validates predictive models — often using machine learning over distributed patterns of activity, connectivity, and structure — that make testable predictions about individual people, evaluated by sensitivity, specificity, and generalizability in new samples.
Q8. In the chest X-ray triage study, what did the predictive model contribute, and what remained the human expert’s job?
Answer: The model, trained on 470,388 chest X-rays, flagged potentially critical films (61% positive predictive value, 95% negative predictive value) so they could be prioritized — cutting the average time to expert review of critical findings from 11.2 to 2.7 days. Radiologists still made the diagnoses; the model improved how quickly the right images reached them.
 The book: Elements of Functional Magnetic Resonance Imaging — Wager & Lindquist, MIT Press