Day 3 · Design, group inference, and ICA in practice

Day 3Session 3.2Wager0:45 hLecture

Group analysis: fixed, random, and mixed effects

This lecture explains why generalizing to a population requires modeling between-subject variance, and compares fixed-effects, two-stage summary-statistics and full mixed-effects approaches. It also covers second-level covariates, effects coding, robust regression for outliers, and the issues that arise when multiple images per subject are taken to the second level.

Take-aways

  • To generalize to a population, between-subject variance must be in the error term and df must come from the number of subjects.
  • The two-stage summary-statistics approach is nearly as efficient as full mixed effects when subjects are reasonably balanced.
  • Covariate coding, outlier handling and repeated-measures dependence each change the interpretation and validity of group maps.

Key terms

  • variance components
  • fixed effect
  • random effect
  • summary statistics approach
  • Holmes and Friston
  • mixed effects model
  • effects coding
  • robust regression (IRLS)
  • nonsphericity
  • second-level covariate
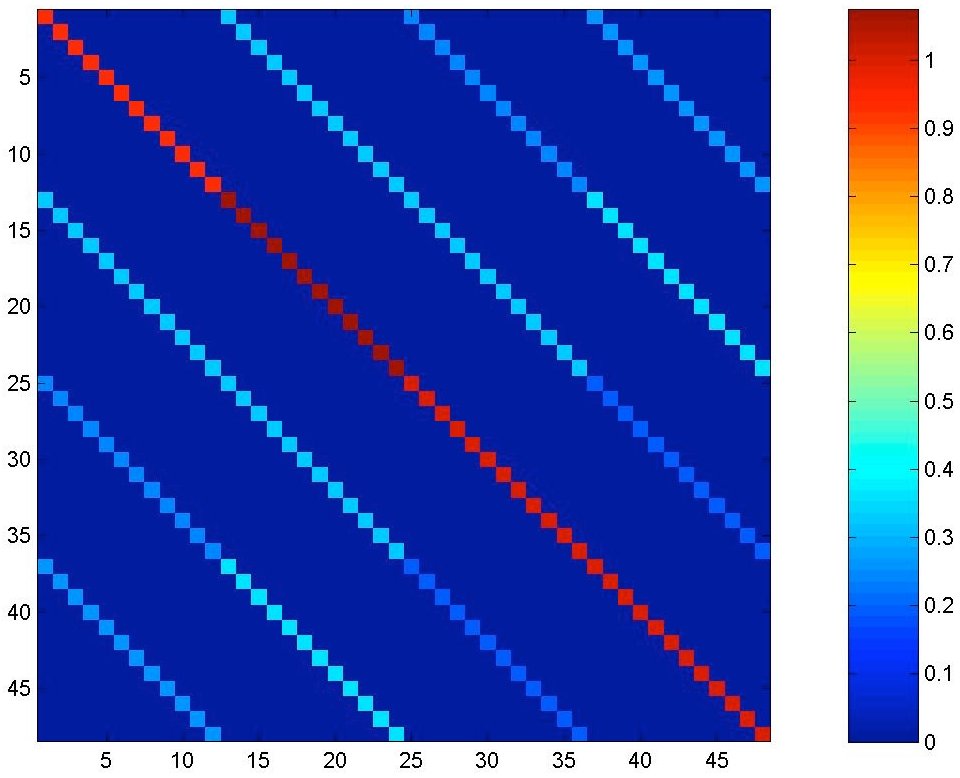
Autocorrelated error covariance matrix used in mixed-effects modeling
Autocorrelated error covariance matrix used in mixed-effects modeling. Lecture 3.2 slides (Wager)

Outline

What the session covers

01Sources of variance and terminology

  • Group data contain unexplained error (E), design-related inefficiency (D) and individual differences (I).
  • Mixed effects, hierarchical models and random effects (RFX) in neuroimaging are the same idea: multiple variance components.
  • Fixed-effects models have a single variance component: scan-to-scan measurement error.
  • Only by including both measurement error and subject-to-subject variation can you generalize to unobserved subjects.
02Fixed versus random effects

  • A fixed effect has the same levels in every experiment (sex, drug type); a random effect has levels sampled from a population (subject, day, word).
  • If subject is treated as fixed, the error term omits between-subject variability and results cannot generalize to new subjects.
  • Fixed-effects error uses scan-to-scan variance with degrees of freedom from the number of scans; random-effects uses between-subject variance with df from subjects.
  • The sleepstudy example shows both intercepts and slopes varying randomly across participants.
  • Intra-subject variance can make every subject look different from zero while the population effect is not.
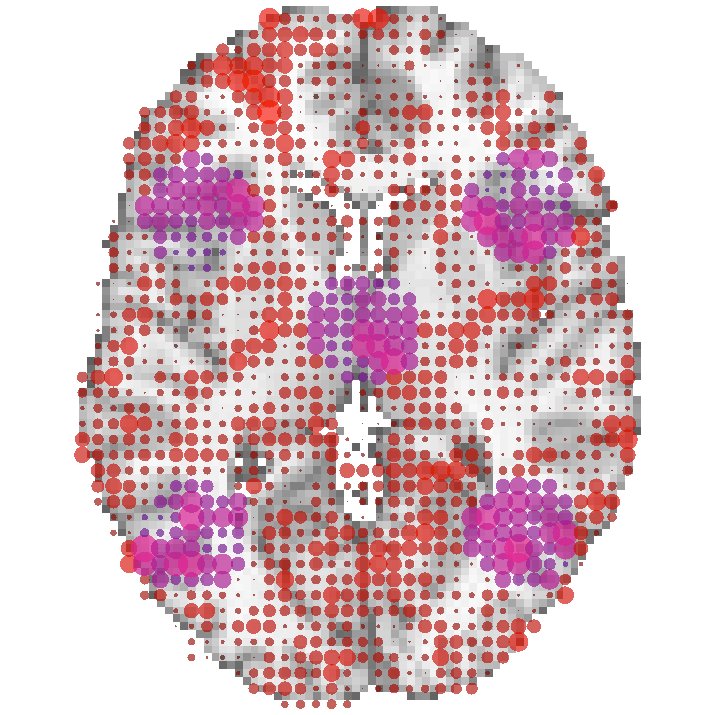
Voxel-wise group effects rendered as colored dots on an axial slice
Voxel-wise group effects rendered as colored dots on an axial slice. Lecture 3.2 slides (Wager)
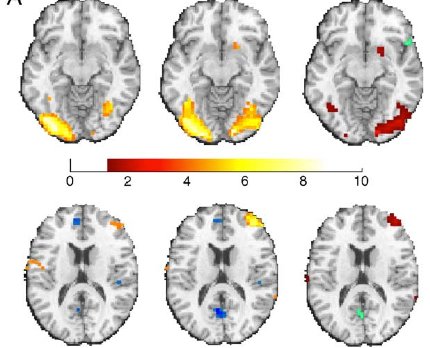
OLS versus robust (IRLS) group maps and their difference
OLS versus robust (IRLS) group maps and their difference. Lecture 3.2 slides (Wager)

03Two-stage summary statistics versus full mixed effects

  • Two-stage approach (Holmes and Friston): estimate contrasts per subject, then t-test the contrast images across subjects.
  • Full mixed effects fits all trials in one model with random intercepts and slopes (lmer, fitlme, HLM, SAS proc mixed; spm_mfx, FSL FEAT, FEMA).
  • Combined model: the error term contains residual noise divided by within-subject sample size plus between-subject variance divided by N.
  • If within-subject variance differs across subjects, summary statistics are still unbiased but degrees of freedom are off; weighted least squares fixes this.
  • Mumford and Nichols (2006) and Olszowy et al. (2019): power differences between the two approaches are modest; summary statistics is valid under the null.
  • The grand GLM on concatenated data is wrong: it assumes independence within subjects and equal error variance across subjects.

04Second-level designs and covariates

  • Second-level covariates generate maps of interest (age, performance), explain error variance and control confounds.
  • The intercept is the average group activity when all covariates are zero; an ANOVA can be built from regression predictors.
  • Recommendation: effects-code categorical predictors as [1, -1] without centering, and mean-center continuous covariates.
  • With unequal N, mean-centering a [1, -1] covariate gives weighted effects coding, so the intercept is dominated by the larger group.
  • Controlling covariates can move the group intercept from non-significant to P = 0.001 by reducing residual variance.
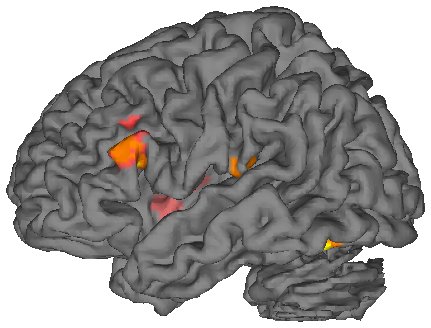
Group activation rendered on an inflated cortical surface
Group activation rendered on an inflated cortical surface. Lecture 3.2 slides (Wager)

05Robust regression for outliers

  • High-variance observations dominate when their values are extreme, and assumptions cannot be checked at every voxel.
  • Iteratively reweighted least squares: weight by inverse leverage, fit, scale and reweight residuals, refit until convergence, then adjust df.
  • A single outlier in N = 50 null data can produce false results that the robust IRLS solution removes.
  • Case studies in motor, pain and visual data show robust regression recovering expected activation.

06Multiple images per subject and alternative summaries

  • SPM handles one image per subject with the Holmes and Friston approach and multiple images with a variance basis (nonsphericity) approach.
  • Repeated measures violate sphericity because measurements within subjects are correlated; 48 images from 12 subjects do not yield 44 df.
  • SPM pools variance estimates across the brain from high-F voxels, which is inaccurate when variance is spatially heterogeneous.
  • Take multiple images to the second level only when a planned contrast is impossible, such as comparing multiple basis functions.
  • Spatial similarity to atlases, Neurosynth terms and neuromaps annotations offers another way to summarize activation maps.
Brain maps of separable signal sources across axial slices — Lecture 3.3 slides (Wager)

From the instructors' research

Related figures

Examples of these concepts in published work by the course instructors.

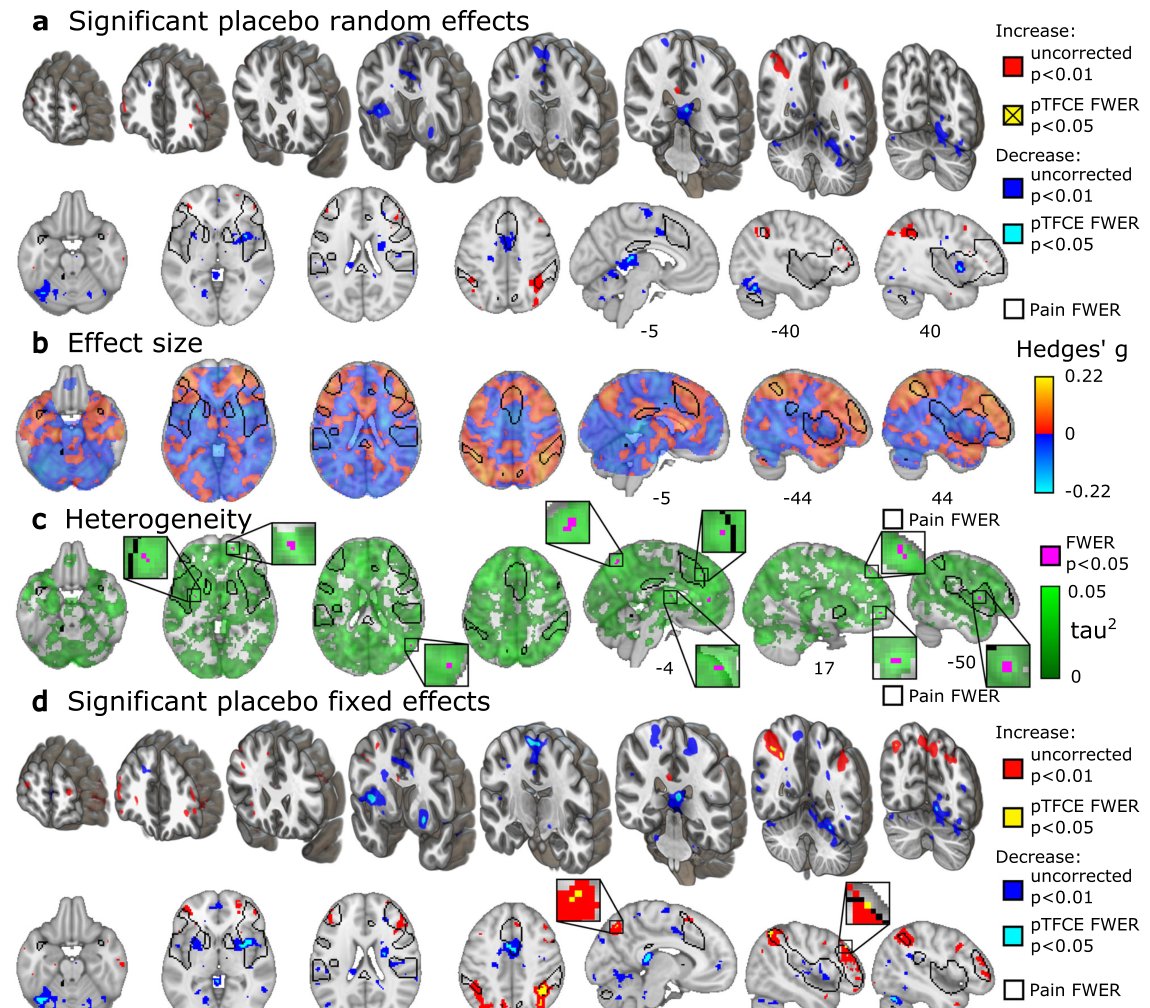
Participant-level meta-analysis maps of placebo analgesia effects
Participant-level meta-analysis maps of placebo analgesia effects. Zunhammer et al. (2021), Nature Communications
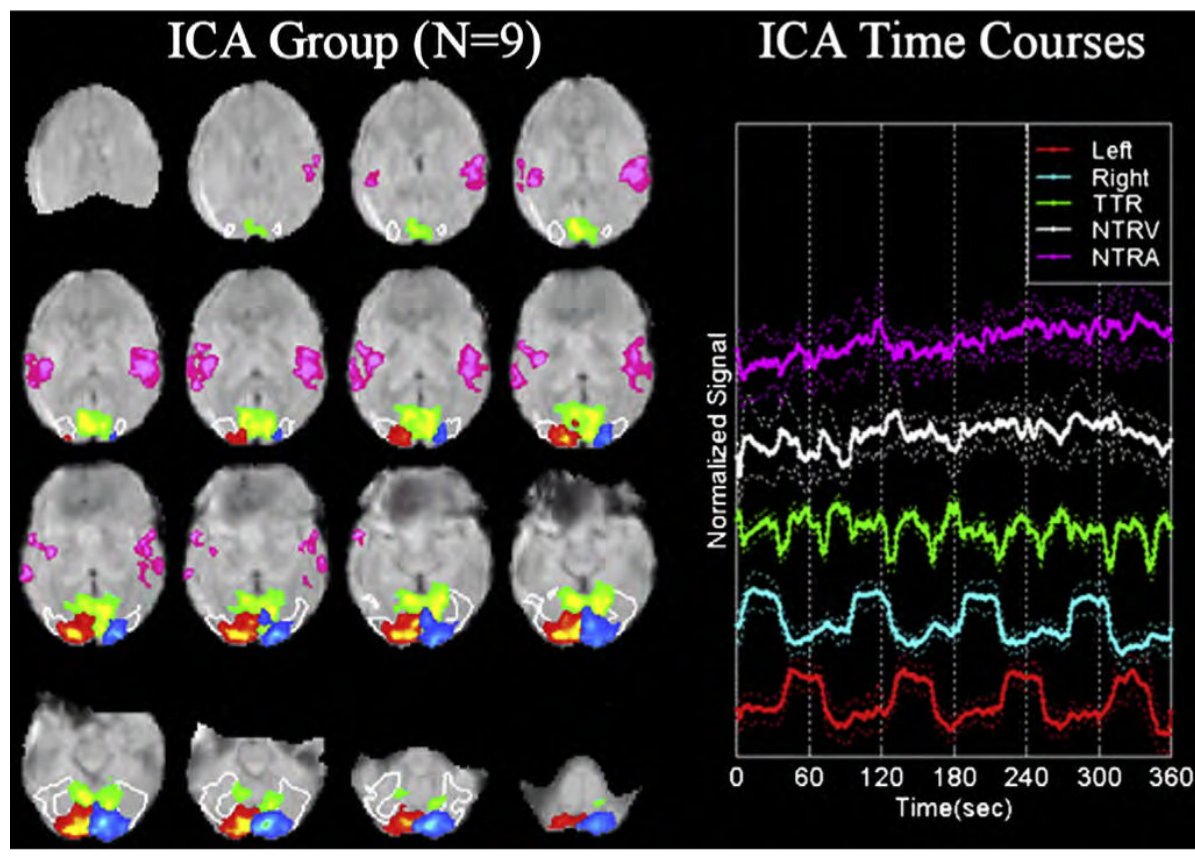
Group ICA component maps and their task-related time courses
Group ICA component maps and their task-related time courses. Calhoun et al. (2009), NeuroImage