Day 3 · Design, group inference, and ICA in practice

Day 3Session 3.3Wager0:45 hLecture

Group analysis: thresholding and inference

This lecture covers how to threshold statistical maps when testing many voxels: voxel-, cluster- and set-level inference, family-wise error control by Bonferroni, random field theory and permutation, and false discovery rate control. It then addresses the power cost of correction, pitfalls of cluster-extent thresholding, inflated effect sizes, and practical solutions such as a priori regions and patterns.

Take-aways

  • Correct per map, not per voxel: FWER lets you interpret each finding, FDR lets you claim most findings are true.
  • Permutation tests adapt to smoothness and are usually the most accurate and sensitive FWER method.
  • Whole-brain correction costs power and inflates effect sizes; a priori regions, patterns and cross-validation reduce the burden.

Key terms

  • family-wise error rate (FWER)
  • false discovery rate (FDR)
  • Bonferroni correction
  • random field theory
  • Euler characteristic
  • permutation test
  • cluster-forming threshold
  • TFCE
  • small volume / mask correction
  • effect size inflation
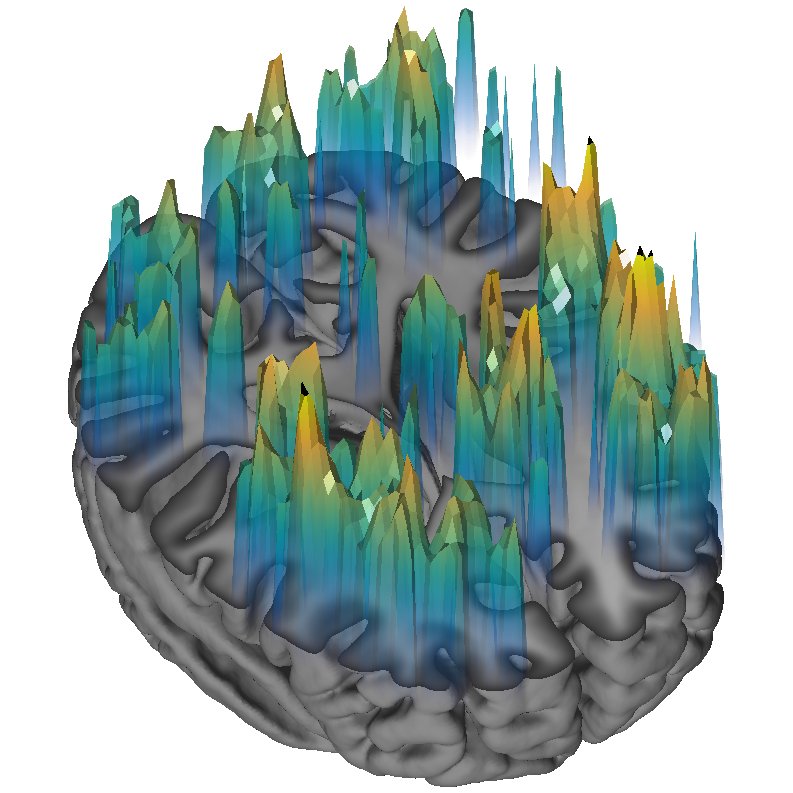
Statistical peaks rising above the cortical surface as a random field
Statistical peaks rising above the cortical surface as a random field. Lecture 3.3 slides (Wager)

Outline

What the session covers

01Levels of inference and the multiple comparisons problem

  • SPM mainly tests signal magnitude at voxels; cluster volume p-values are available but sensitive to the cluster-defining threshold.
  • Testing 100,000 voxels at alpha = 0.05 yields about 5,000 false positives if tests were independent.
  • Arbitrary height plus extent thresholds (p < .001 and 10 voxels) are too liberal because smooth noise produces blob-like false positives.
  • Voxel-level inference is most spatially specific; cluster-level is more sensitive but only says some signal exists somewhere in the blob.
  • Set-level inference only says there is signal somewhere in the brain.

02Family-wise error: Bonferroni and random field theory

  • FWER means the chance of any false positive in the map is below alpha, so every suprathreshold finding can be interpreted.
  • Bonferroni uses alpha over V voxels (p < .05/1000 = .00005); it assumes independence and is conservative under smoothness.
  • Controlling FWER means thresholding the maximum statistic; random field theory gives the distribution of maxima via the Euler characteristic.
  • Corrected p depends on search volume, roughness and statistic value; larger volume or rougher data make correction more severe.
  • RFT needs FWHM smoothness 3 to 4 times voxel size (about 10 times for low-df t images) and stationarity for cluster results.
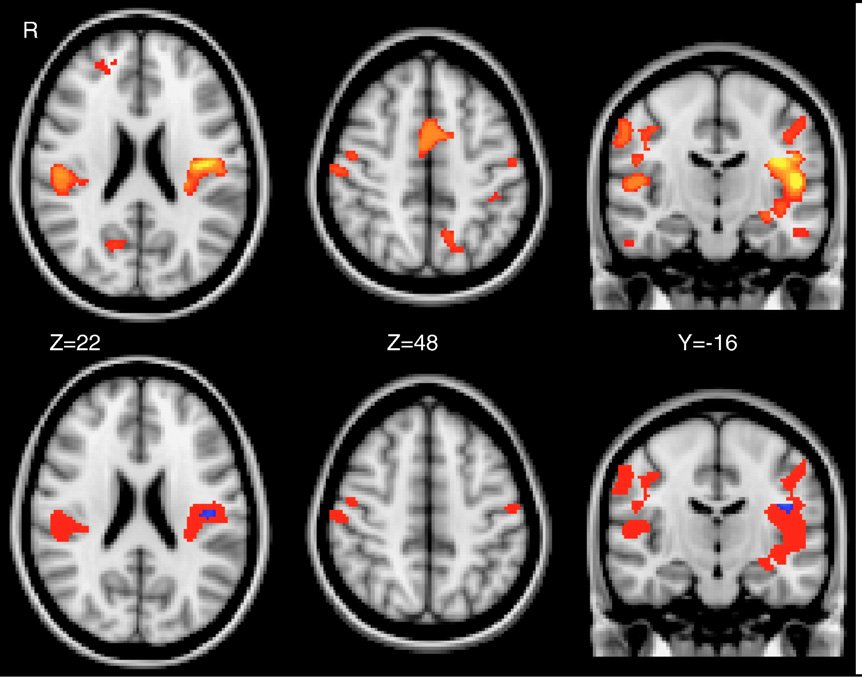
Cluster-based versus voxel-based thresholding of a task map
Cluster-based versus voxel-based thresholding of a task map. Lecture 3.3 slides (Wager)
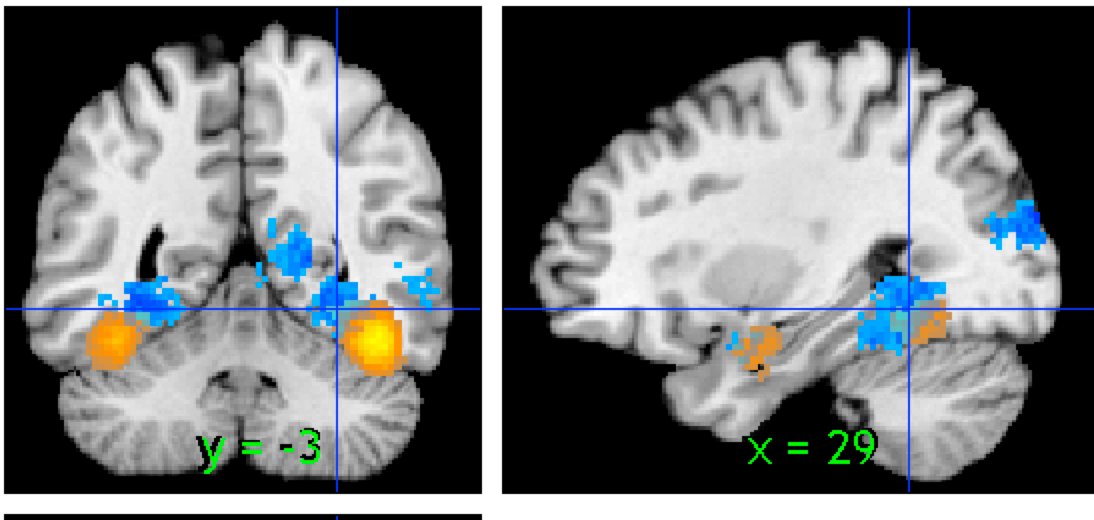
Thresholded contrast map shown in coronal and sagittal views
Thresholded contrast map shown in coronal and sagittal views. Lecture 3.3 slides (Wager)

03Nonparametric permutation tests

  • Permutation uses the data to build the null distribution of any statistic, including the maximum, by relabeling conditions or subjects.
  • Toy example: six ABABAB blocks give 20 relabelings; the 95th percentile of the permutation distribution is the threshold.
  • Requires only exchangeability; subjects are exchangeable, but autocorrelated fMRI time series are not.
  • Nichols and Hayasaka (2003): permutation adapts to smoothness and is closest to truth; RFT is overconservative at low smoothness and df.
  • Smoothed-variance t and TFCE (in FSL randomise) are permutation-based statistics that improve sensitivity.

04False discovery rate

  • FDR is the expected proportion of reported positives that are false; it needs only p-values (Benjamini and Hochberg 1995).
  • Procedure: order p-values and reject those with p(i) below (i/V) times q, for example q = .05 over 1000 voxels.
  • FDR is always more liberal than FWER and adapts its threshold to the amount of signal.
  • You can claim most findings are true, but not which ones are false.
  • Since SPM8, FDR is applied topologically to peaks and clusters; set defaults.stats.topoFDR = 0 for voxel-wise FDR.
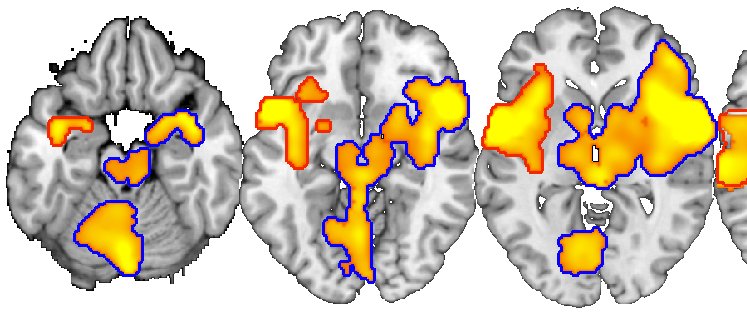
Montage of axial slices with thresholded activation
Montage of axial slices with thresholded activation. Lecture 3.3 slides (Wager)

05Cluster extent, TFCE and masking

  • Cluster mass integrates height above the cluster-forming threshold and combines peak and extent information.
  • TFCE sums cluster support over all thresholds with parameters H = 2 and E = 0.5, avoiding a cluster-forming threshold.
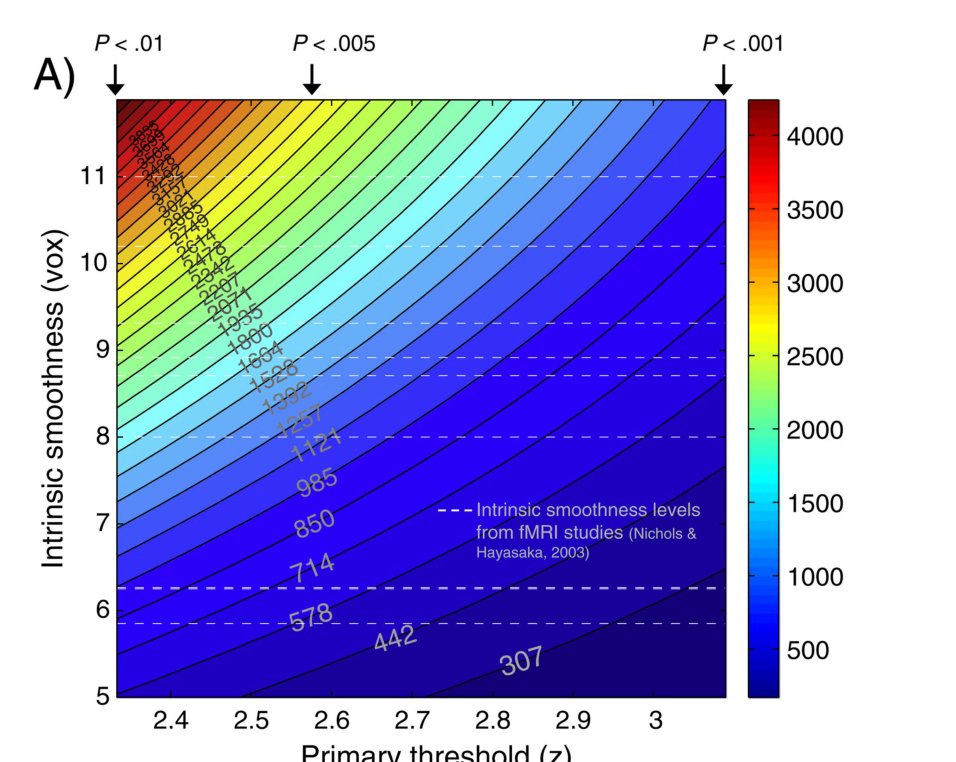
  • Woo et al. (2014): with low cluster-forming thresholds, clusters span multiple anatomical regions and cannot be localized.
  • Recommendations: use voxel-level when powered; cluster-level only with p < .001 forming threshold and small blobs.
  • Correcting within a gray-matter mask instead of the whole brain mask improves power.

06Power problems and solutions

  • Median voxel-wise effect sizes are about d = 0.5 even in robust tasks (Poldrack et al. 2016; HCP N = 186).
  • With whole-brain FWER correction and low power, four studies of the same true effect may share zero overlapping voxels.
  • Post hoc effect sizes from significant voxels are inflated, and stricter thresholds make the inflation worse (Reddan et al. 2017).
  • Solutions: a priori ROIs from meta-analysis, testing parcels or networks, predefined patterns, and cross-validation.
  • Pattern responses generalize the ROI idea, need no thresholding and can be more sensitive than single regions.
PINES negative-affect signature rendered on cortical surfaces — Chang et al. (2015), PLoS Biology

From the instructors' research

Related figures

Examples of these concepts in published work by the course instructors.

Cluster extent thresholds versus smoothness and primary threshold
Cluster extent thresholds versus smoothness and primary threshold. Woo et al. (2014), NeuroImage
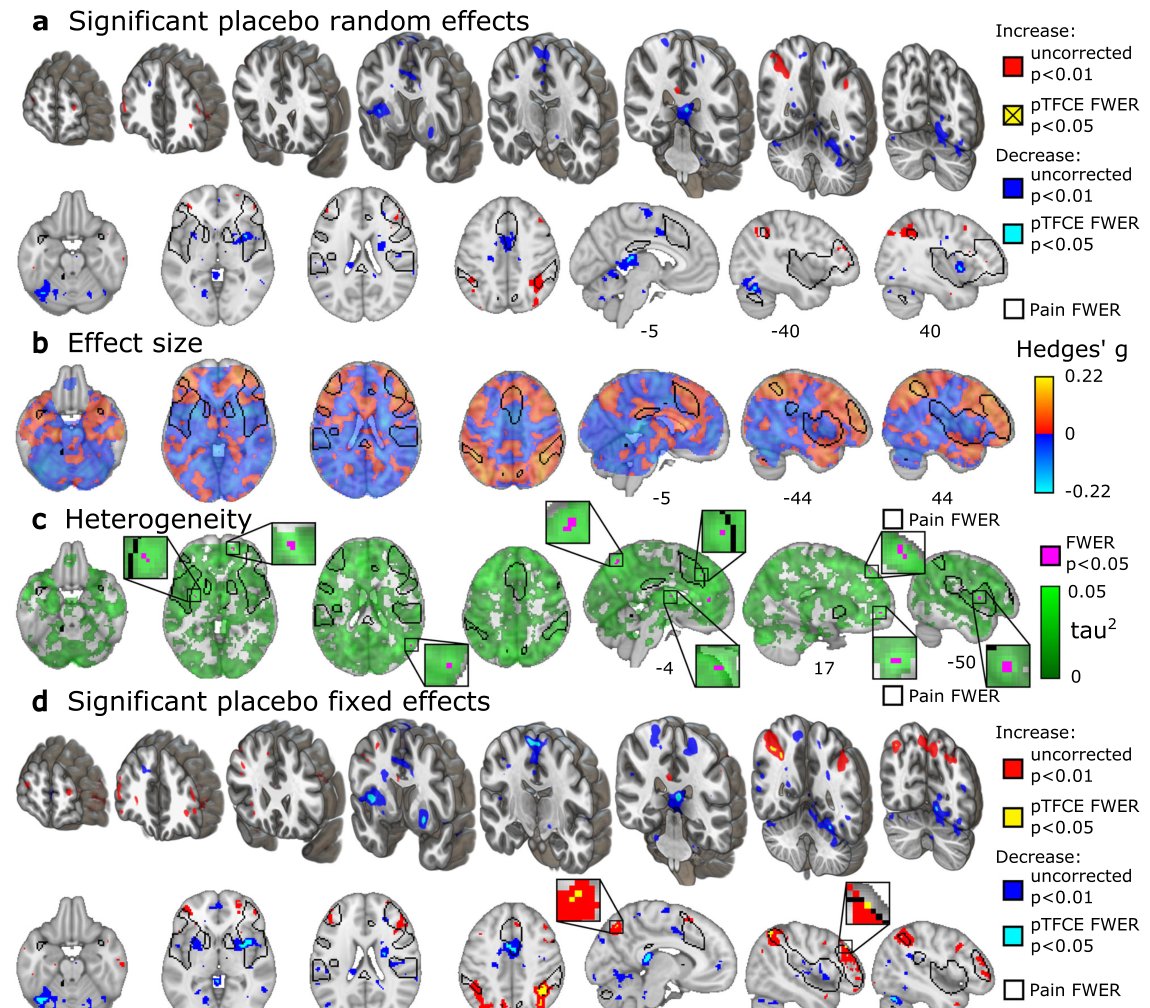
Participant-level meta-analysis maps of placebo analgesia effects
Participant-level meta-analysis maps of placebo analgesia effects. Zunhammer et al. (2021), Nature Communications