Day 3 · Design, group inference, and ICA in practice

Day 3Session 3.5Calhoun1:00 hLecture

ICA II: fMRI

This lecture extends ICA to multi-subject fMRI: how components are combined across subjects, how single-subject maps and time courses are recovered by back-reconstruction, and how group inferences are made on ICA outputs. It also surveys processing issues (model order, motion, autocorrelation, filtering, denoising), task versus rest, and applications in diagnosis, prediction and dynamic connectivity.

Take-aways

  • Group ICA concatenates PCA-reduced data so that components are directly comparable, then recovers subject-specific maps and time courses.
  • ICA outputs (maps, time courses, FNC, spectra) feed standard GLM or multivariate tests for group inference.
  • Preprocessing choices, motion, autocorrelation and model order all shape ICA results and must be reported.

Key terms

  • group ICA
  • back-reconstruction
  • GICA3
  • dual regression
  • model order
  • functional network connectivity (FNC)
  • MANCOVA
  • spatially constrained ICA
  • NeuroMark
  • dynamic FNC
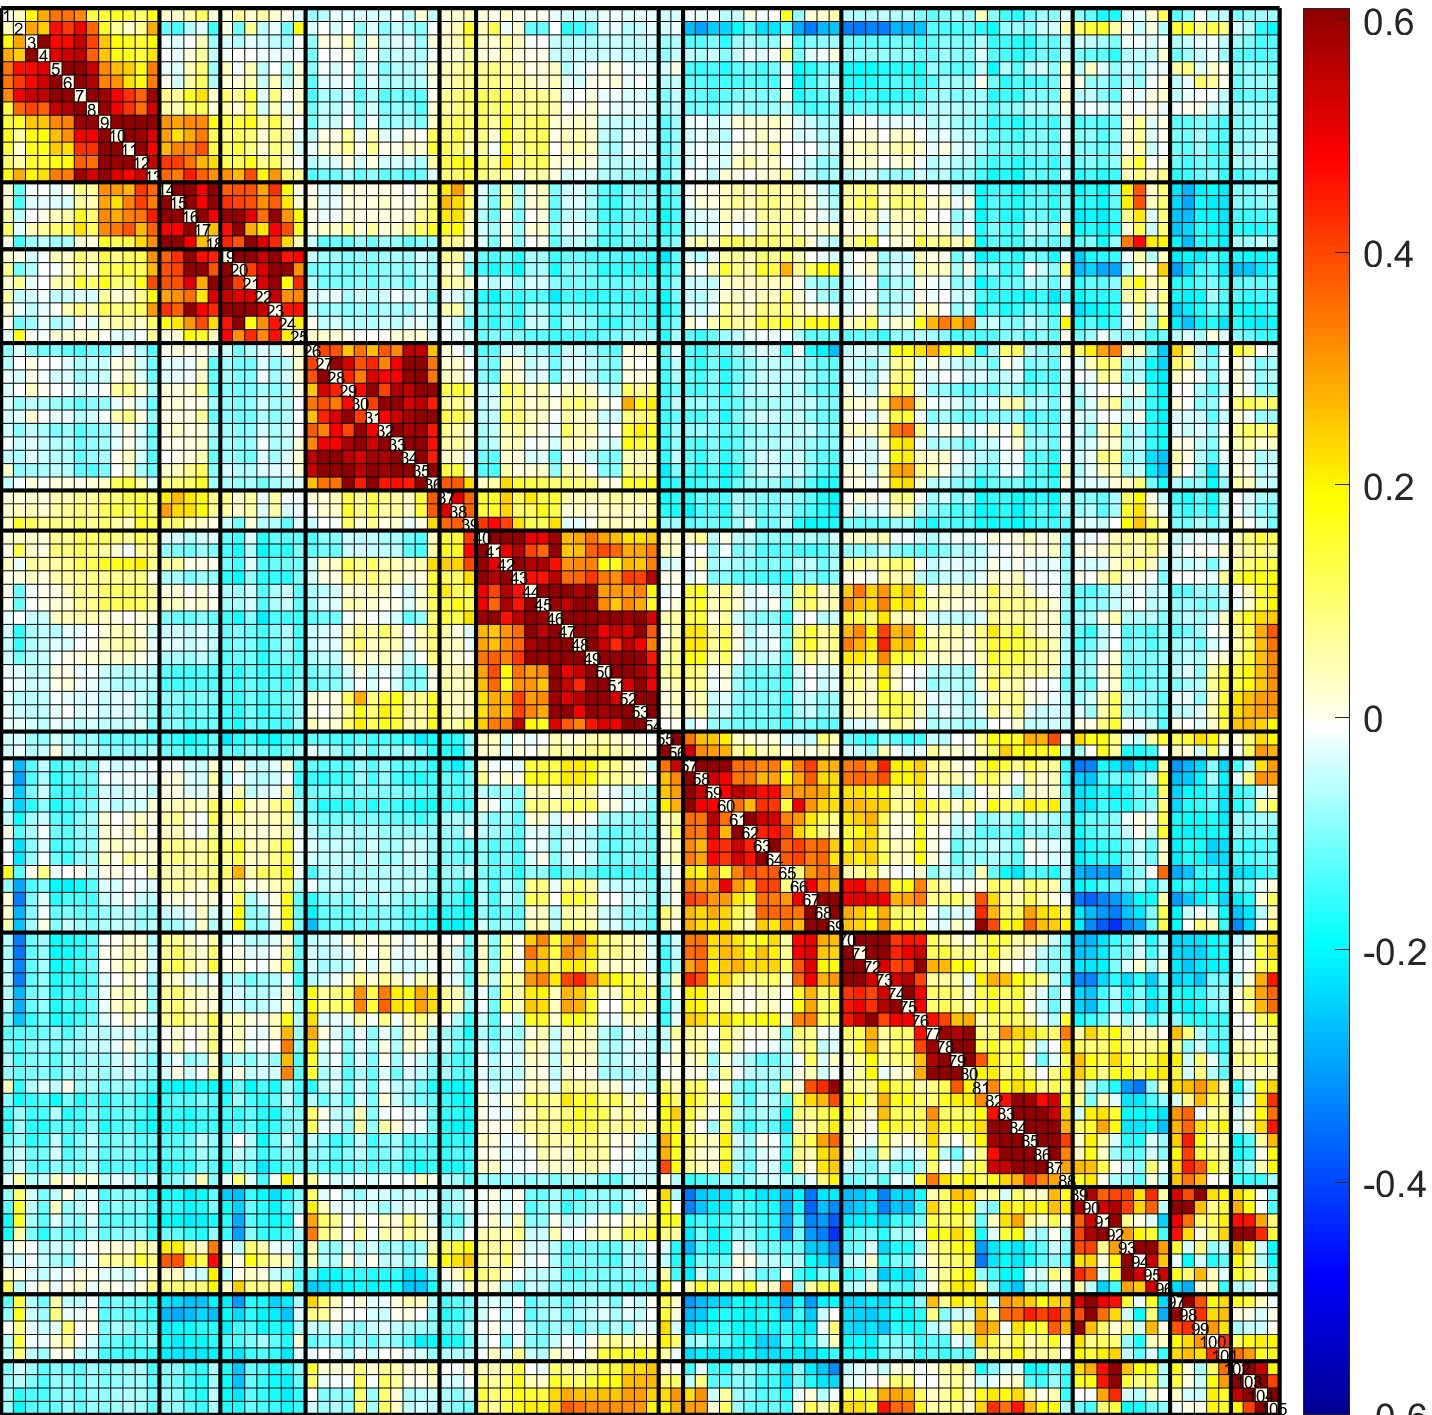
Functional network connectivity matrix between ICA components
Functional network connectivity matrix between ICA components. Lecture 3.5 slides (Calhoun)

Outline

What the session covers

01Combining ICA across subjects

  • Two questions: how to combine components across subjects and how to threshold and present the results.
  • Approach 1 runs a separate ICA per subject, then requires matching which components to compare across individuals.
  • Approach 2 (group ICA) stacks reduced data across subjects so components and time courses are directly comparable.
  • Pipeline: subject-level PCA, concatenation, group PCA, ICA, then back-reconstruction of subject maps and time courses.
  • In a 10-subject visual-perception task, ICA found the SPM network plus primary motor, anterior frontal and superior parietal regions.
02Back-reconstruction and validation

  • Back-reconstruction methods: GICA1, GICA2, GICA3 and spatial-temporal (dual) regression; GICA3 improves both maps and time courses.
  • Simulations show a subject's unique source is recovered with little influence from other subjects.
  • ICA assumes stationarity across subjects; task activation is stationary while physiological noise is not, yet activation is preserved.
  • SimTB simulations vary rotation, position, amplitude and inter-component correlation to test what group ICA recovers.
  • Peak locations and functional localization are preserved under moderate spatial variability between subjects.
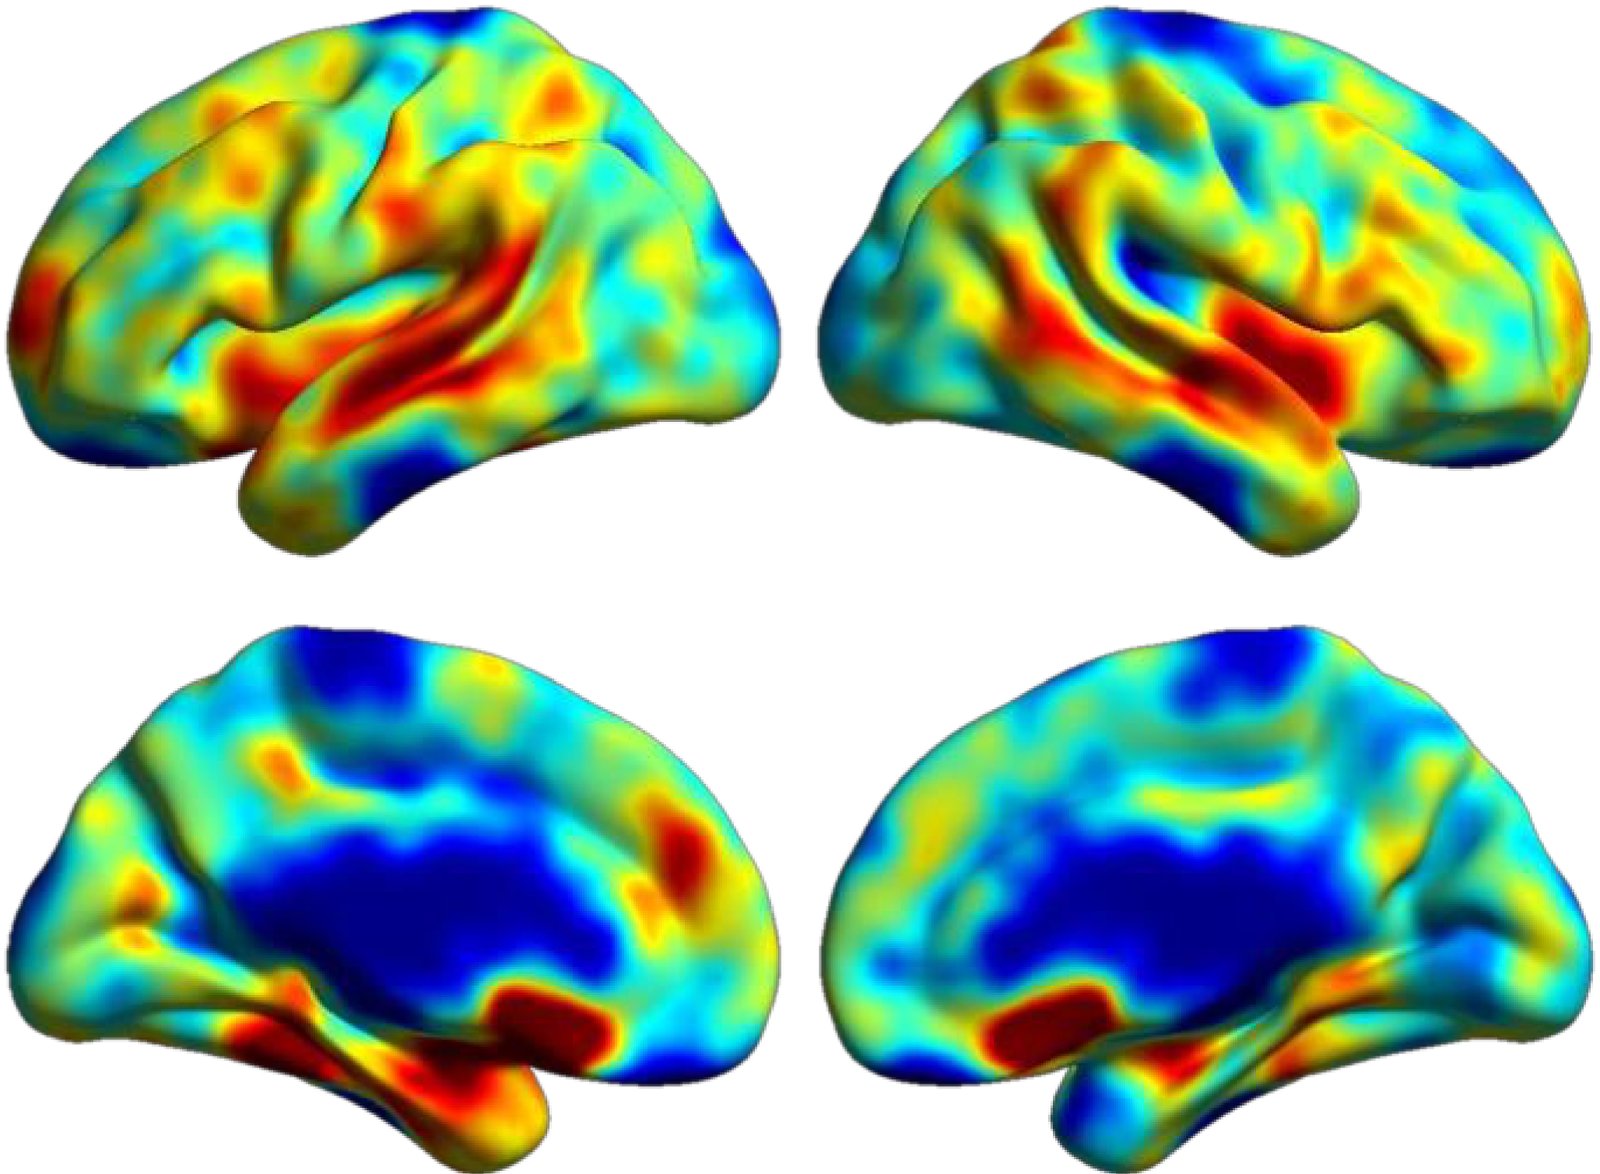
ICA component loadings mapped onto lateral and medial cortical surfaces
ICA component loadings mapped onto lateral and medial cortical surfaces. Lecture 3.5 slides (Calhoun)
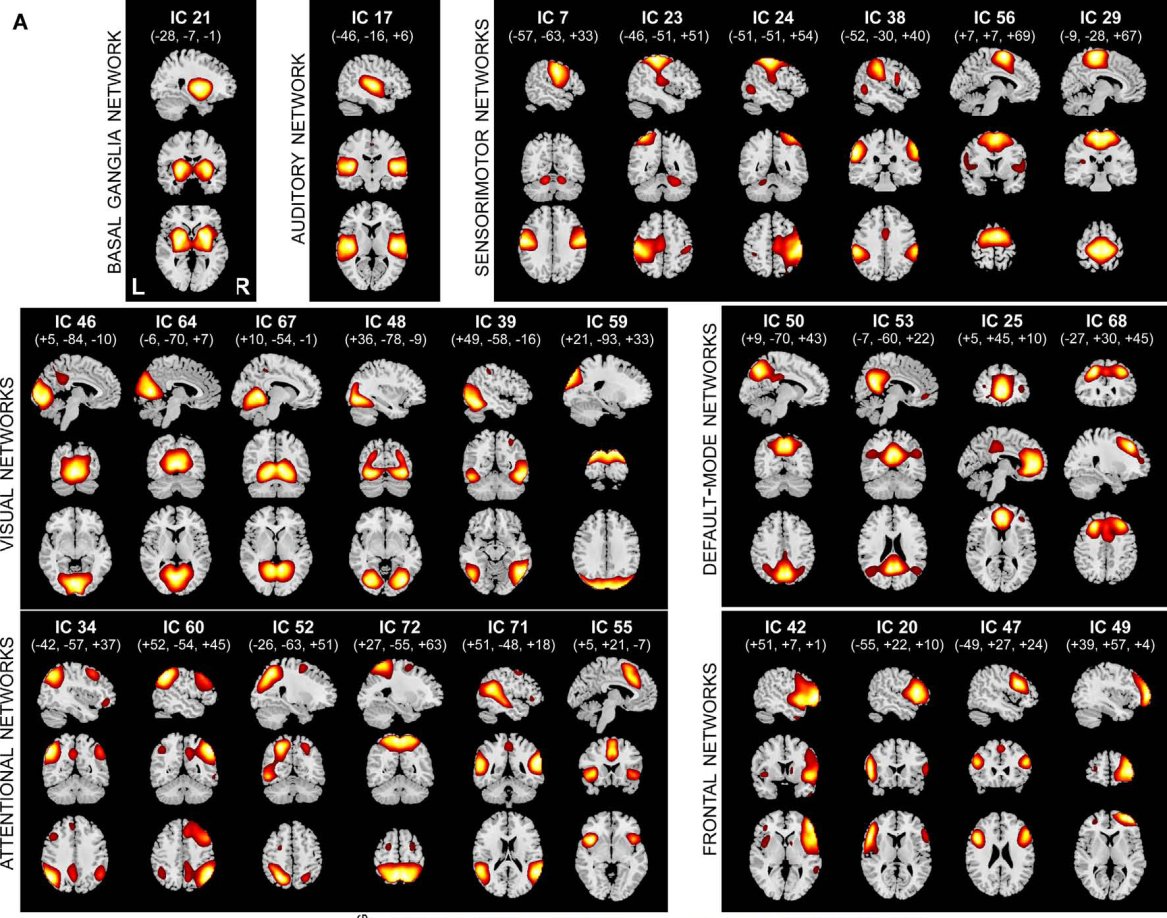
Gallery of intrinsic network components from group ICA
Gallery of intrinsic network components from group ICA. Lecture 3.5 slides (Calhoun)

03A simple example and its output

  • Nine-subject visuomotor study: TR = 1 s, 360 volumes, reduced 360 to 25 per subject, concatenated 225 to 20 components.
  • Group ICA maps thresholded at t > 4.5 matched GLM random-effects maps and appeared more sensitive to hemodynamic differences.
  • Right and left visual field stimulation were separable both in group ICA and per-subject ICA.
  • Second-level analysis takes ICA parameters (regression fit amplitudes, voxel weights) into a standard GLM hypothesis-testing framework.
  • Components are sorted by R-squared between ICA time courses and model regressors, then betas are tested across subjects.

04Multivariate testing framework and connectivity

  • Multivariate tests ask whether any of a set of voxels or components is affected by a covariate, rather than testing each voxel alone.
  • Outputs analyzed jointly: spatial maps, functional network connectivity (FNC, correlation among component time courses) and spectra.
  • Resting ICA of 603 subjects yielded 28 labeled networks among 75 components; FNC differs between patients and controls.
  • Automated classifiers and sorting distinguish noise components from intrinsic networks and reorder FNC matrices.
  • Multi-scale ICA (20 to 100 components) shows diagnosis and motion effects on FNC with distinct patterns; 1000-component ICA gives fine overlapping units.
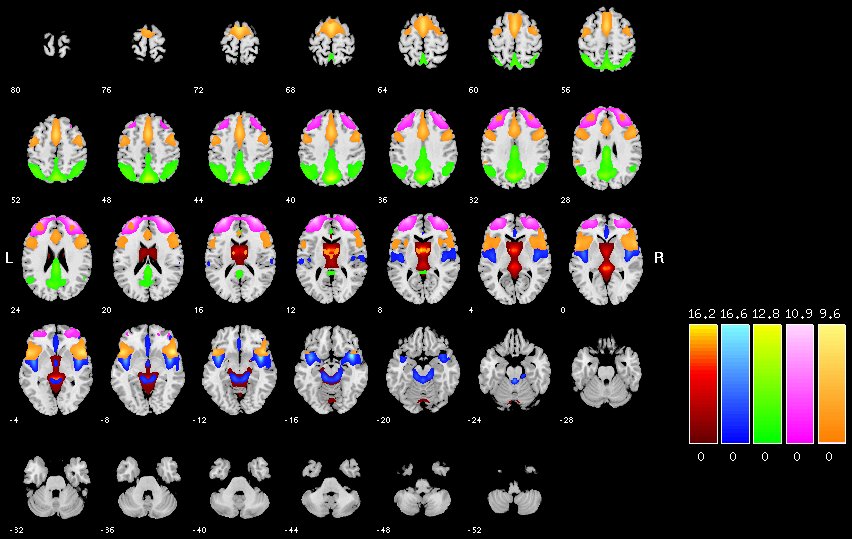
Color-coded ICA spatial components on axial slices
Color-coded ICA spatial components on axial slices. Lecture 3.5 slides (Calhoun)

05Processing issues

  • Pre-normalization choices: none, intensity normalization (divide by voxel mean) or variance normalization (voxel-wise z-scoring) affect reliability.
  • Motion: non-movers, continuous movers (FD > 0.2 mm) and spiky movers (FD > 0.5) compared with regression or scrubbing pre- and post-ICA.
  • Temporal autocorrelation inflates correlation p-values; corrected inference and autoconnectivity features are needed.
  • High-frequency filtering may remove signal along with noise (baby vs. bathwater).
  • Denoising via classifiers of noise components at the single-subject and group level; seed and ICA connectivity are closely related.
  • Spatially constrained ICA uses network priors from HCP and other datasets to get subject-specific maps with preserved labels.

06Task versus rest, applications and tools

  • Auditory oddball and rest yield highly similar networks (correlations 0.78 to 0.96), but task modulates their spatial and temporal properties.
  • Applications: schizophrenia classification from FNC and spatial maps, mood-disorder medication response, simulated driving with alcohol.
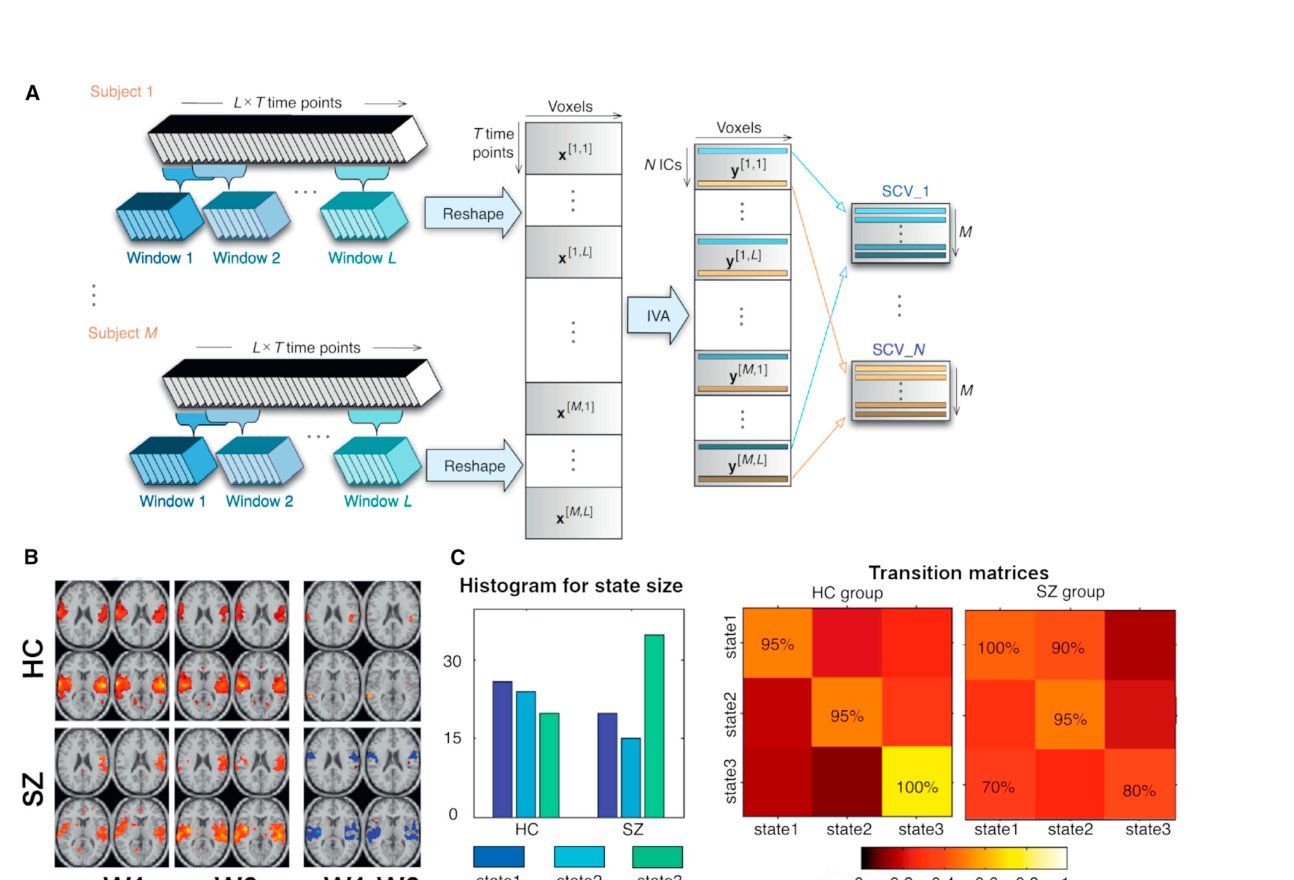
  • Dynamic FNC with sliding windows and time-frequency methods captures changing connectivity states.
  • GIFT provides group ICA, MANCOVA, ICASSO stability, dynamic FNC and source-based morphometry; SimTB simulates data.
  • NeuroMark templates from 100k+ subjects at model orders 25 to 200 enable fully automated, comparable single-subject ICA.
Gallery of ICA components estimated by two group-ICA methods — Lecture 3.5 slides (Calhoun)

From the instructors' research

Related figures

Examples of these concepts in published work by the course instructors.

Windowed dynamic connectivity, states and transition matrices
Windowed dynamic connectivity, states and transition matrices. Calhoun et al. (2014), Neuron
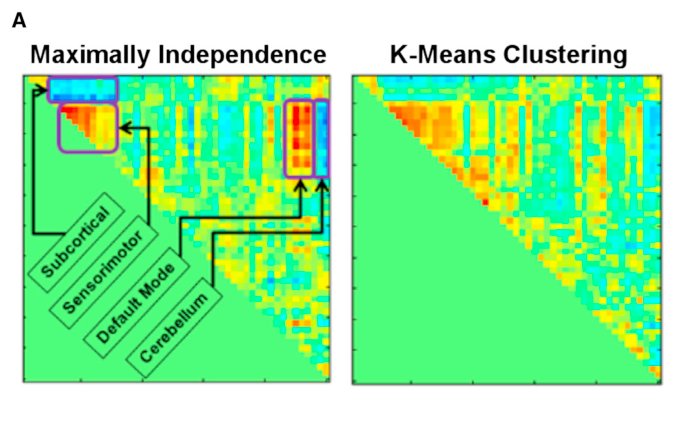
Maximally independent versus k-means connectivity states
Maximally independent versus k-means connectivity states. Calhoun et al. (2014), Neuron