Day 2 · Modeling, connectivity, and ICA

Day 2Session 2.3Wager0:45 hLecture

GLM multicollinearity and diagnostics

This session reviews the statistical assumptions behind GLM p-values and what happens when each is violated, then focuses on two practical hazards in fMRI regression: multicollinearity among predictors and high-leverage observations. It introduces variance inflation factors, the hat matrix, and robust or nonparametric alternatives, and shows how to check an SPM design with CANlab's scn_spm_design_check.

Take-aways

  • Valid p-values require independence, identical distributions, linearity, normality, and equal variance; check diagnostics rather than assuming them.
  • Collinear predictors inflate parameter variance and make betas model-dependent; use VIFs and scn_spm_design_check, not just pairwise correlations.
  • High-leverage points can create or hide effects, particularly in second-level brain-behavior regressions; check leverages and consider robust regression.

Key terms

  • multicollinearity
  • variance inflation factor (VIF)
  • condition number
  • estimability
  • hat matrix
  • leverage
  • influence
  • homoscedasticity
  • robust regression (IRLS)
  • scn_spm_design_check
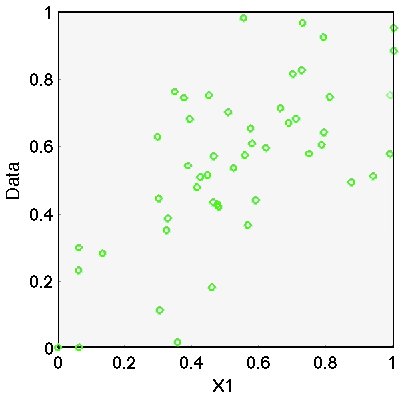
Scatter of two correlated predictors with regression line
Scatter of two correlated predictors with regression line. Lecture 2.3 slides (Wager)

Outline

What the session covers

01Review: the SPM first-level pipeline and its assumptions

  • SPM is mass univariate: design specification saved in SPM.mat, model estimation, contrasts, and results, one voxel at a time.
  • Outputs: beta images, ResMS.img (error variance), con images (c-transpose-b), spmT images, and ess and spmF images for F-contrasts.
  • Predictors are built by convolving indicator (onset) functions with an assumed HRF basis function.
  • This assumes the neural activity function is correct, the HRF is correct, and the system is linear and time-invariant.
02Assumptions required for valid p-values

  • Identically distributed: if violated, subgroups can mask or reverse effects and outliers can dominate even large samples.
  • Independence: if violated, p-values are too liberal, nominal degrees of freedom are overestimated, and slopes are unbiased but more variable.
  • Linearity: if violated, power is lost or inference is incorrect, especially in multiple regression.
  • Normality: if violated, p-values are wrong with no simple rule for the direction of error.
  • Equal variance (homoscedasticity): if violated, p-values are too liberal and degrees of freedom overestimated.
  • Remedies: SPMd diagnostics (Luo and Nichols), log transforms for skewed behavioral data, nonparametric tests (SnPM, Spearman), and robust regression (IRLS).
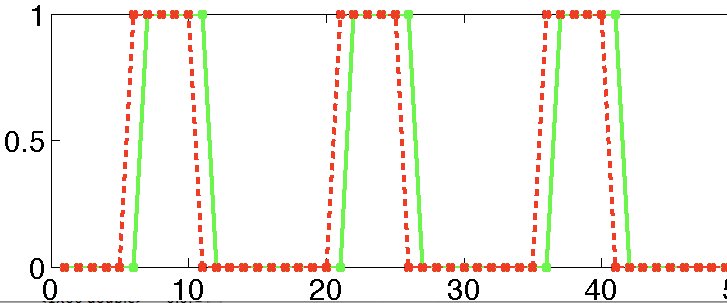
Two overlapping block predictors that are nearly collinear
Two overlapping block predictors that are nearly collinear. Lecture 2.3 slides (Wager)
Parameter estimates for two collinear predictors
Parameter estimates for two collinear predictors. Lecture 2.3 slides (Wager)

03Multicollinearity

  • Correlated predictors increase the variance (uncertainty) of parameter estimates because it is unclear which predictor should be assigned credit.
  • Which predictor fits best depends only on the time points where the predictor values differ.
  • Inference on one beta depends on getting the model for the other parameters right, including predictors you did not know to include.
  • Interpretation is model-dependent: the sign of a beta can flip after controlling for an omitted grouping variable collinear with it.
  • Nuisance regressors may be correlated with each other as long as you do not interpret their individual betas; the spanned subspace is what is controlled.

04Practical: variance inflation factors and design checks

  • VIF is the multiplicative increase in error variance due to design collinearity; VIF = 2 means error variance is doubled.
  • VIF reflects how much of a regressor is explained by a linear combination of the others; condition number is an alternative index.
  • Pairwise correlations are not enough; a regressor can be predicted by a combination of others even when each pairwise correlation is modest.
  • Steps: download CanlabCore from github.com/canlab, add to the MATLAB path with subfolders, go to the single-subject SPM directory, run scn_spm_design_check.
  • Run the check after specifying contrasts: contrasts must be uniquely estimable and should not lose variance to high-pass filtering, even when individual regressors look fine.
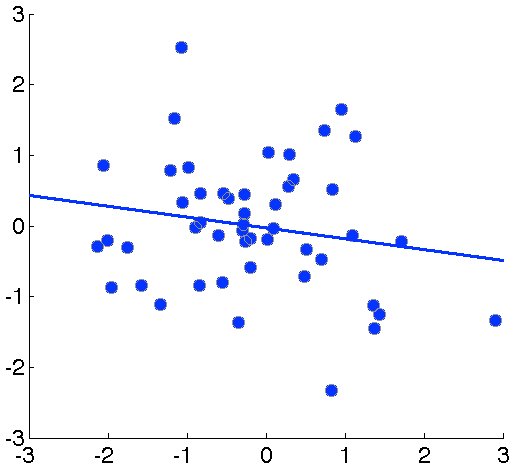
Simulated data points against a predictor
Simulated data points against a predictor. Lecture 2.3 slides (Wager)

05Leverage and outliers

  • In null data with N = 50, a single outlier can create a spurious significant effect.
  • Influence, the pull on the fit, increases with the square of the distance from the regression line.
  • Hat matrix H = X (X'X)^-1 X'; H times the data gives fitted values and diag(H) gives each point's leverage.
  • Check leverages at the second level, where every voxel is regressed on the same behavioral or clinical predictors.
  • Fixes: censor or winsorize outliers with caution, or use robust regression (IRLS) to minimize the influence of outliers at high-leverage points.

06Take-home

  • Check for multicollinearity: look at the design matrix visually and compute VIFs.
  • Check leverages, especially in group-level brain-behavior regressions.
  • P-, t-, and Z-values are only valid if the GLM assumptions hold.
  • A predictor with a significant fit does not by itself establish that it is the right explanation; interpretation depends on the full model.
Tissue segmentation of axial brain slices in warm and cool tones — Lecture 2.2 slides (Wager)

From the instructors' research

Related figures

Examples of these concepts in published work by the course instructors.

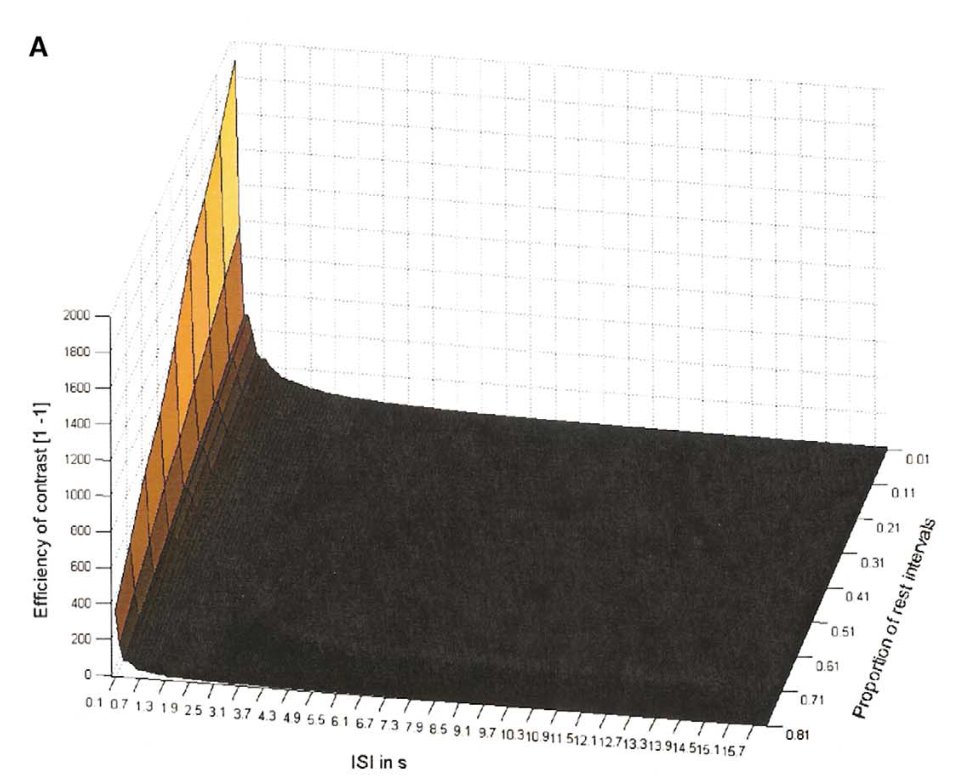
Design efficiency as a function of ISI and rest proportion
Design efficiency as a function of ISI and rest proportion. Wager & Nichols (2003), NeuroImage