Day 1 · Acquisition, preprocessing, and the GLM

Day 1Session 1.5Kiehl1:00 hHands-on session

Intro to SPM: data checking, reorienting data

Introduces Statistical Parametric Mapping, its history and why it is widely used, then begins the preprocessing pipeline with the two steps people most often skip: looking at the raw images and reorienting them to resemble the SPM EPI template, and running ArtRepair to find and replace bad volumes. These steps give later registration the best possible starting point and produce covariates for the first-level model.

Take-aways

  • Look at your raw data once, carefully, and make it resemble the SPM EPI template before any automated step.
  • Reorientation changes the header and writes a .mat transform; keep a record of what you changed.
  • ArtRepair replaces bad volumes and gives you regressors to include at the first level.

Key terms

  • Statistical Parametric Mapping
  • Display routine
  • reorientation
  • EPI template
  • origin
  • ArtRepair
  • bad volume
  • interpolated volume
  • nuisance covariate
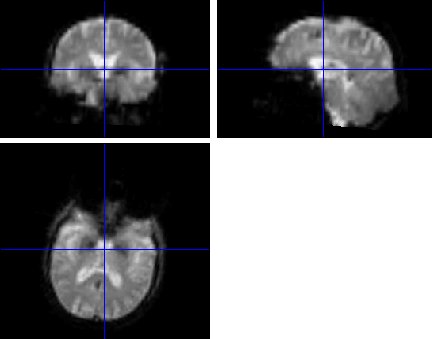
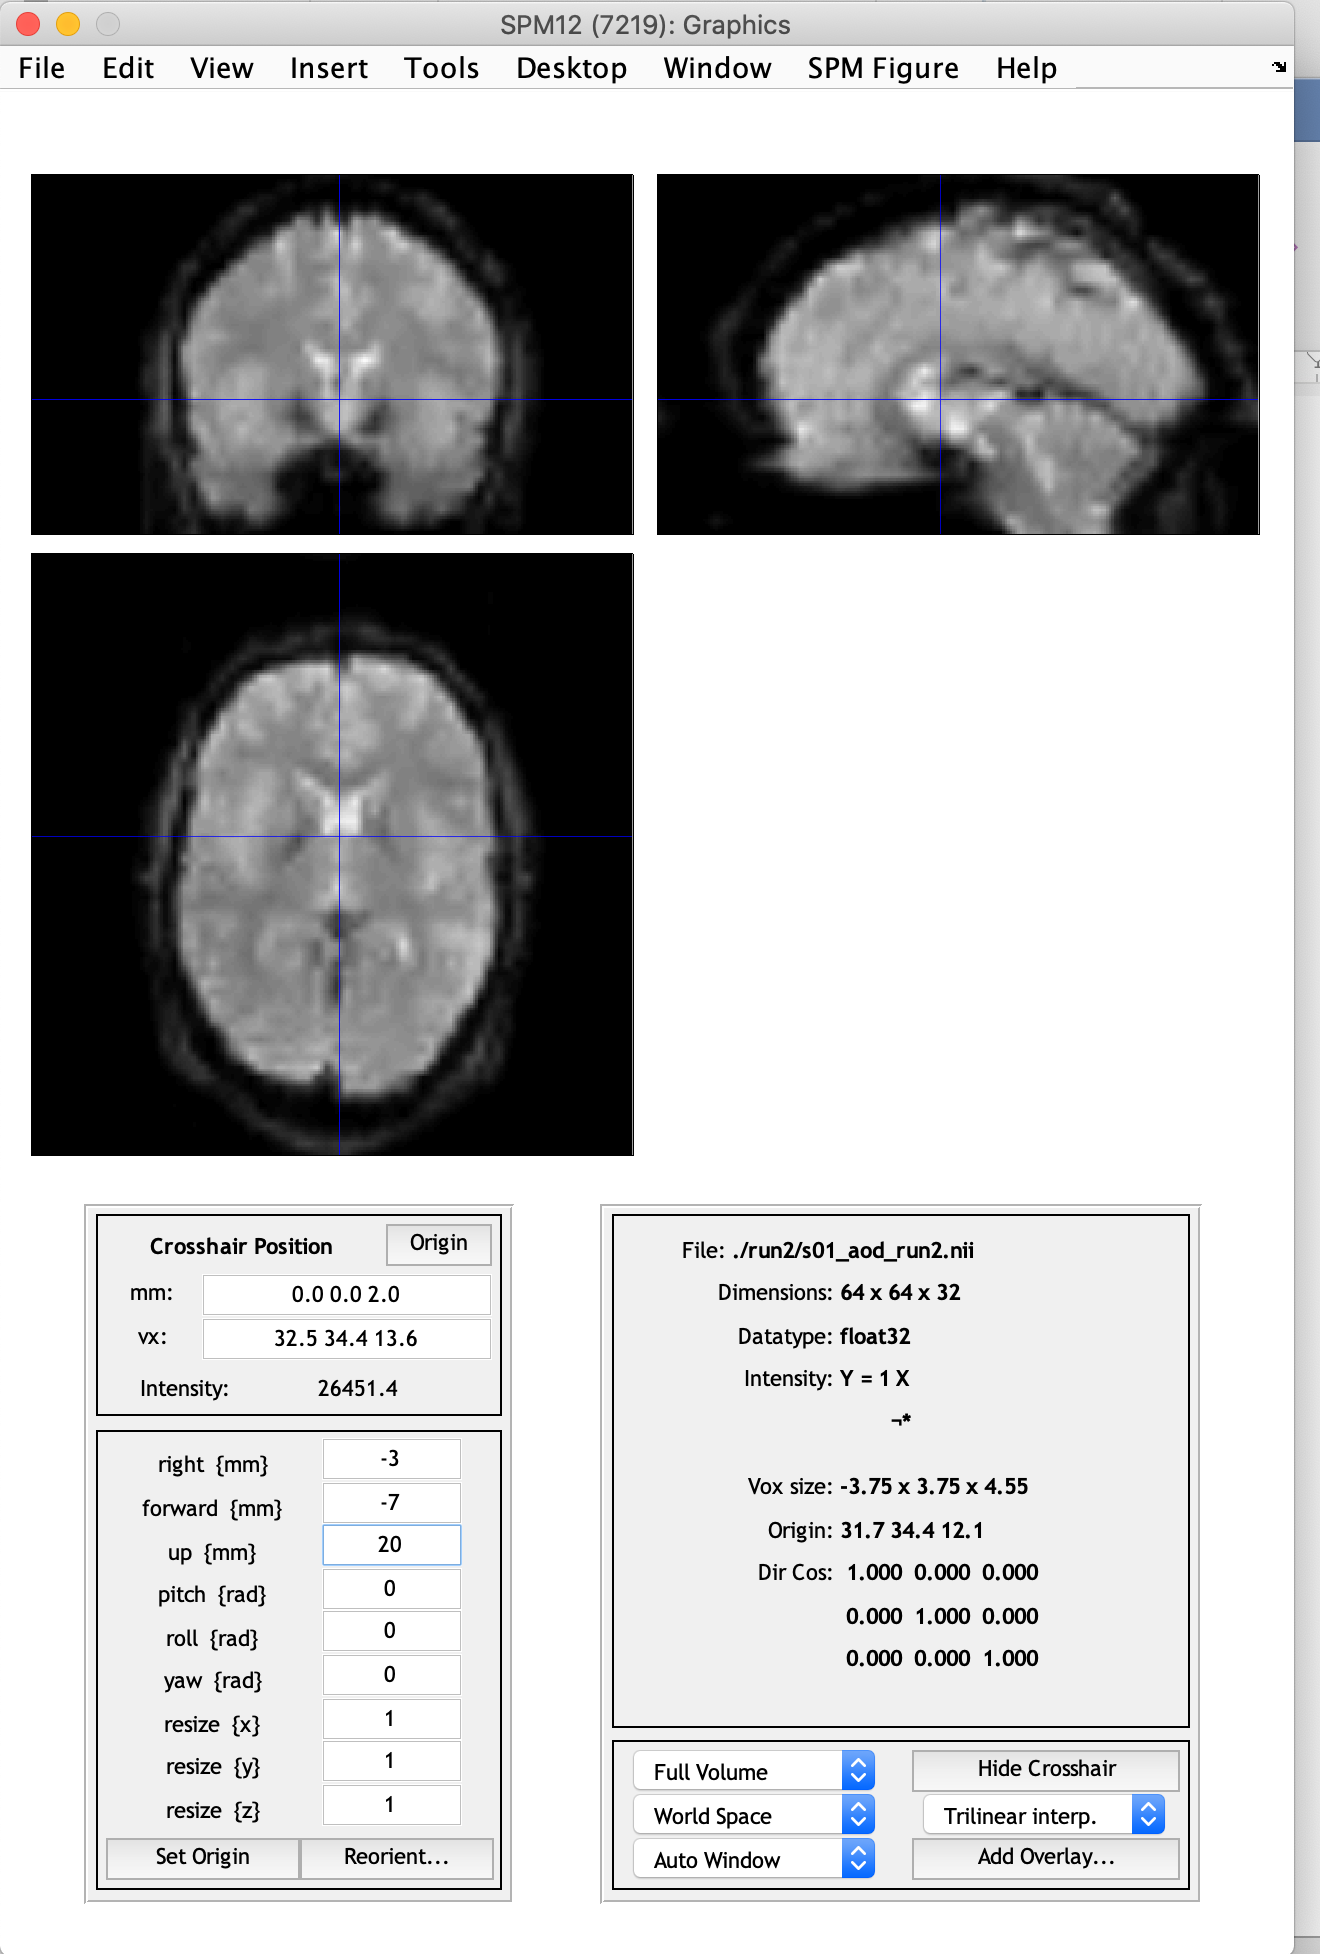
Orthogonal views of an EPI functional volume
Orthogonal views of an EPI functional volume. Lecture 1.5 slides (Kiehl)

Outline

What the session covers

01History of SPM

  • Started in 1991 in response to PET studies that reduced large datasets to a few regions of interest, with poor localization and reproducibility.
  • Public release in 1994 (SPMclassic); SPM94 for PET, SPM95 added fMRI, SPM96 major revision, SPM97 added event-related fMRI.
  • SPM99, SPM2, SPM5/8 were successive revisions still in use; SPM12 is the current version.

02Why SPM

  • Free, relatively easy to use, with an active help list.
  • Platform independent because it runs in MATLAB, and relatively easy to modify.
  • About ten developers, thousands of users, and modules subjected to peer review.
  • Customizable through editing and a toolbox mechanism.
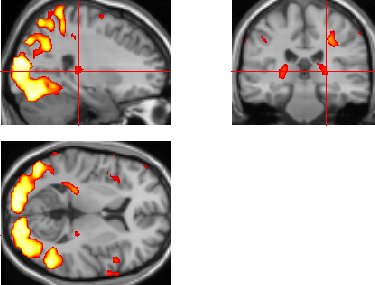
Activation maps overlaid on anatomical slices
Activation maps overlaid on anatomical slices. Lecture 1.5 slides (Kiehl)

03Data checking and reorientation with Display

  • This may be the only time you look at your raw images: check orientation, voxel sizes, and artifacts.
  • Goal: adjust the images so they look like the SPM EPI template; the closer the match, the better the starting estimates for registration and normalization.
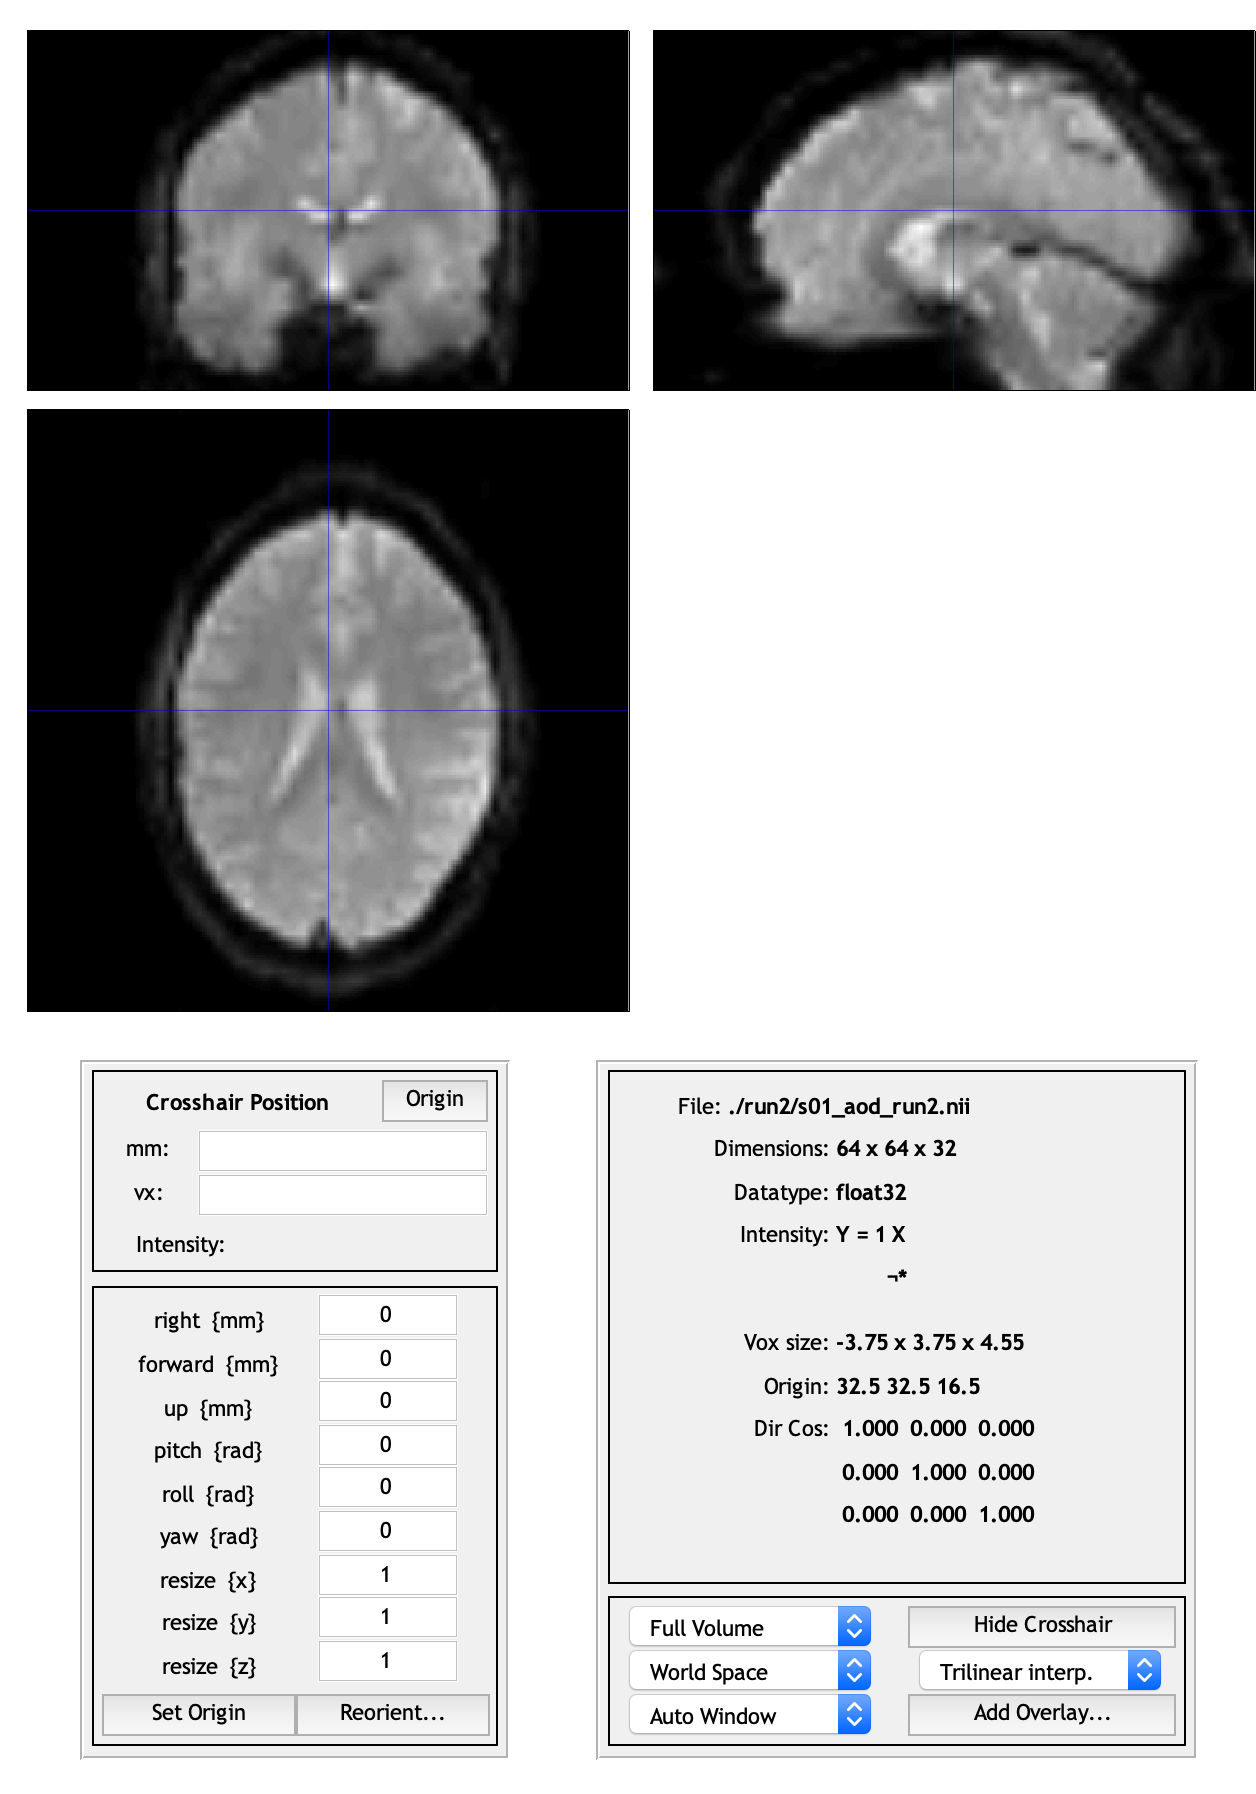
  • In Display, select s01_aod_run1.nii,1 and enter translations and rotations in the x, y, z boxes until the image resembles the template.
  • Click Reorient and apply the transform to all images in the run (and optionally all runs for the subject).
  • Outputs: s01_aod_run1.mat with the transformation, a modified .nii header, and optionally s01_aod_run1_reorient.mat; record the values in your code book.

04Artifact detection and repair with ArtRepair

  • Purpose: identify bad volumes caused by motion, gradient problems, or RF spikes.
  • Bad volumes are replaced by interpolated images and a covariate (0 everywhere, 1 at the repaired scan) is written for the first-level model.
  • Dialog choices: global mean Auto; realignment files No; select all images; always repair first scan No (it was already checked during reorientation).
  • If images are flagged, click Repair then interp; output is vs01_aod_run1.nii (v for volume repair).
  • Also written: art_repaired.txt (repaired image numbers), art_regressors.txt (one regressor per repaired image), and a JPEG of the summary plot.
PINES negative-affect signature rendered on cortical surfaces — Chang et al. (2015), PLoS Biology

Hands-on

Step by step

The walk-through below is distilled from the course cheat sheets. Data paths refer to the course Dropbox folder (e.g. data/auditory_oddball).

  1. Start spm12 (type spm fmri) and click Display.
  2. Navigate to c:\mind\data\auditory_oddball\AOD_raw\s01\run1, set the frame filter to [1:200], select s01_aod_run1.nii,1 and click Done.
  3. Compare the image with the SPM EPI template (shown in the normalization slides).
  4. Enter the provided x, y, z translation and rotation values in the boxes at lower left until the image resembles the template.
  5. Click Reorient, select all images s01_aod_run1.nii,1 to 189 (right-click, Select All), click Done; save the reorient matrix if prompted.
  6. Display the images again and click Origin to confirm SPM now has the updated orientation; repeat for s01 run2 and other subjects.
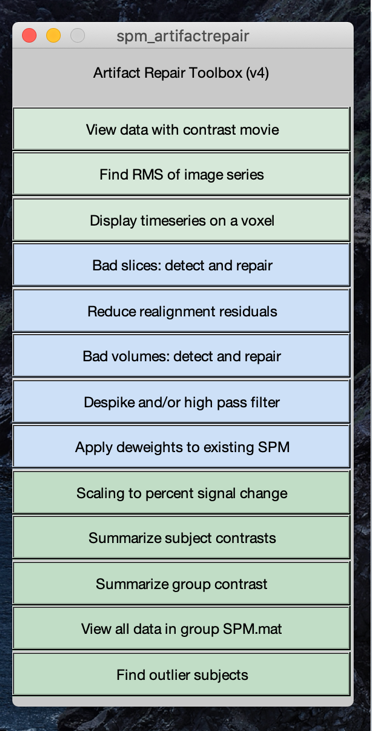
  7. Open Toolboxes > Art Repair and click Bad volumes: detect and repair.
  8. Answer: global mean = Auto; realignment files = No; select all frames of s01_aod_run1.nii; always repair first scan = No.
  9. Inspect the plot; if volumes are flagged, click Repair and choose interp.
  10. Check outputs: vs01_aod_run1.nii, art_repaired.txt, art_regressors.txt (to be entered as first-level covariates).
Cheat sheet: re-orientation — full cheat sheet

Mind fMRI Image Acquisition and Analyses Course - Cheat Sheet for Course Re-orientation

-Re-orientation – using the ‘Display Routine’ in SPM12.

Purpose:

  1. Have a look at your data, check to make sure image is in the right orientation; voxel sizes etc are all correct. Look for artifacts. This is likely the only time you will look at your images.

  2. Adjust your data so that it looks like the SPM EPI template. This will provide SPM with the best starting estimates for your data. The more similar your data are to SPM templates, the more likely the processes will run smoothly.

Initiate:

– Display function.

  • Start spm12.

  • Click on the ‘Display’ button.

‘select the first image in the time series for subject 1, run 1.

  • Select directory ‘c:\mind\data\auditory_oddball\AOD_raw\s01\run1’

  • use the filter settings [1:200] in the window to help you select the right scans

    • Click and select ‘s01_aod_run1.nii,1’

  • CLICK on ‘DONE’ to pull up the first image.

  • It is often useful to review the EPI template image on Display as well. This picture is available from the lecture slides on spatial normalization.

  • You may manually alter the way that spm views the image. For s01/run1 (and s01/run2 below), please enter the following:

Graphical user interface Description automatically generated

In the boxes to the left, you can ‘reorient’ the images so they look like the template. The below values in x, y, z, will move the images into closer register. Then after the images look better, you can click ‘Reorient’ button botton left.

Then select all images for this subject (you may choose to do this for all runs for this subject) and click done. Then display the images again and click ‘origin’ and you will see that SPM now ‘knows’ details about your data and SPM will use this information to help spatial registration steps (like normalization).

A picture containing text Description automatically generated

  • Select data for subject 1 session 1 - directory ‘c:\mind\data\auditory_oddball\AOD_raw\s01\run1’

  • use the filter settings [1:200] in the window to help you select the right scans

    • Right click on mouse and ‘select all’ images

      • s01_aod_run1.nii,1 to s01_aod_run1.nii,189’

- CLICK on ‘DONE’

Repeat for different runs/subjects.

You may be prompted to save the matrix file for the changes you made, please feel free to save this file as a record of your edits. Or writing them down in your codebook.

This process will create ‘s01_aod_run1.mat’ (a matlab file that contains the transformation/re-orientation info), it will also modify the ‘s01_aod_run1.nii’ file/header fields. And if you saved the reorient values, then there will also be a ‘s01_aod_run1_reorient.mat’.

Cheat sheet: ArtRepair — full cheat sheet

Mind fMRI Image Acquisition and Analyses Course - Cheat Sheet for Art Repair (a process to find and destroy bad images in your time series!).

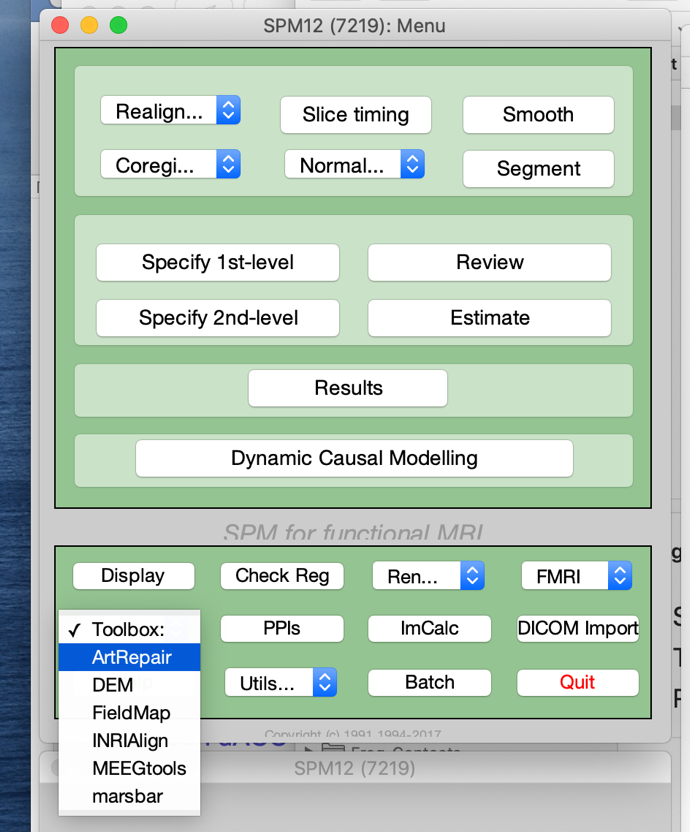
Under toolboxes, select ‘Art Repair’ in SPM.
Graphical user interface, application Description automatically generated

- Table Description automatically generated with low confidence

This GUI will emerge, we will be using the ‘Bad volumes, detect and repair’. Click that button.

Purpose:

  1. To identify bad images due to motion or other MRI artifacts (i.e., gradient issues, RF spikes).

  2. To replace bad images with interpolated images and then output a covariate (zeros for all time points except a 1 where the bad images is). These covariates are used at the first level to address the bad image (that has been replaced).

Initiate:

After you click on Bad volumes: detect and repair, a dialog box will populate the bottom left window in the SPM gui. ‘Which global mean to use? - select Auto. Then it asks whether you have ‘realignment files’ – click no. Next it asks to input the images to analyze. Go select ‘…AOD_raw/s01/run1/ and then expand s01_aod_run1.nii. Highlight all images and select. Click done. Now you have the final question, ‘always repair 1st scan of each session’ Note that you have already reviewed the first scan of the session during ‘reorientation’ so there should not be any problems with this image, so normally you can select ‘no’. but it’s fine to also select ‘yes’.

The coded will now review your data.

This screen will pop up.
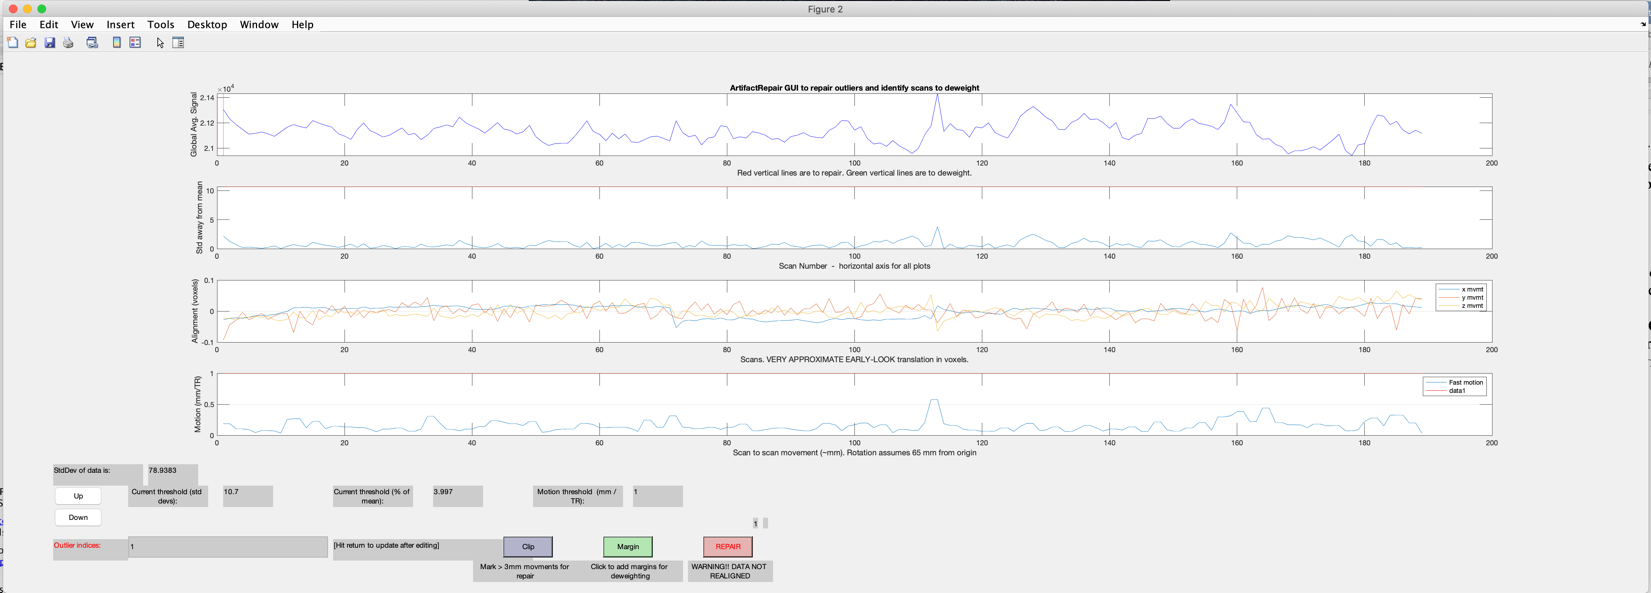
Calendar Description automatically generated

This will highlight whether there are any bad images. In this case there are no bad images. If you did see flagged images, then click ‘Repair’ and the code will write out a new volume of images for you where the bad images have been replaced and new vectors will be outputted as well that contain the covariate you will include in the first level model.

After clicking ‘repair’ select ‘interp’ which will provide interpolated images, replacing the bad images. This will generate a new nii file ‘vs01_aod_run1.nii’. the ‘v’ (volume repair) represents the new fixed image file. Also, you will see ‘art_repaired.txt’ (contains image number that were repaired), ‘art_regressors.txt’ (vectors containing 0s for all images in time series and a 1 where the repaired image was in the time series; one regressor per repaired image; these vectors should be imported into spm first level analyses for this subject; ‘artglobaldataart_repair_example.jpg – copy of the output from art repair.

From the instructors' research

Related figures

Examples of these concepts in published work by the course instructors.

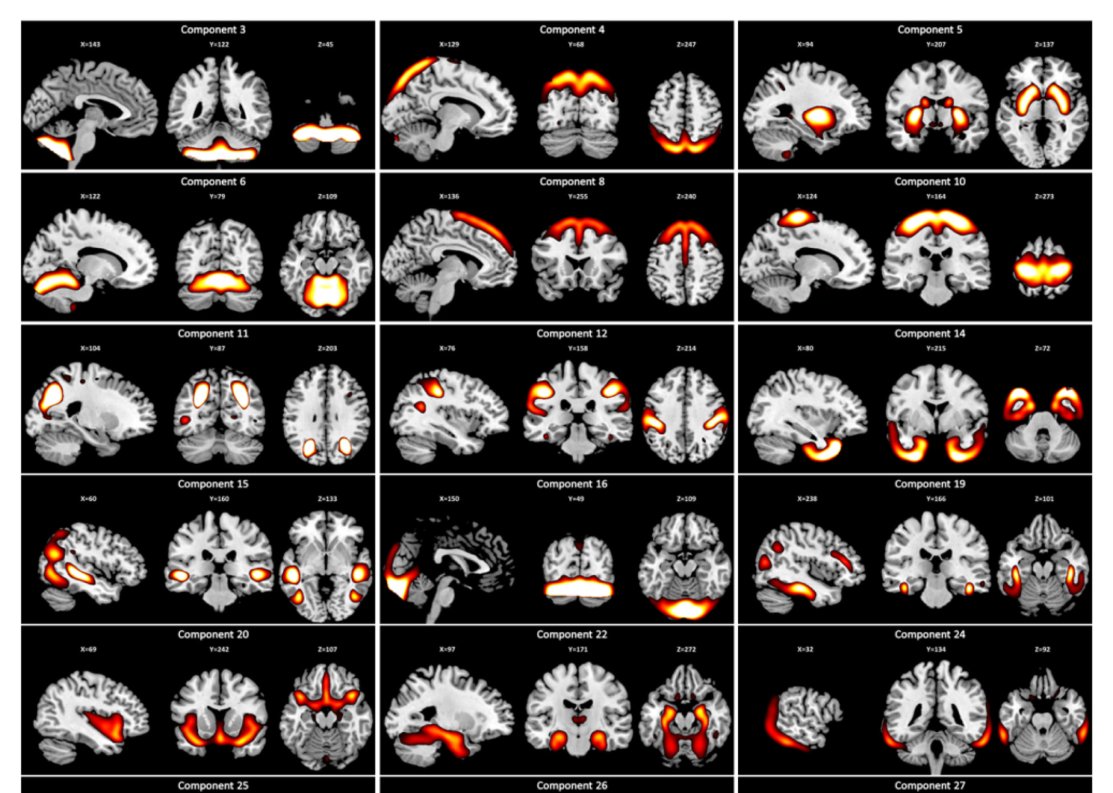
Source-based morphometry gray matter components predicting recidivism
Source-based morphometry gray matter components predicting recidivism. Kiehl et al. (2018), NeuroImage: Clinical
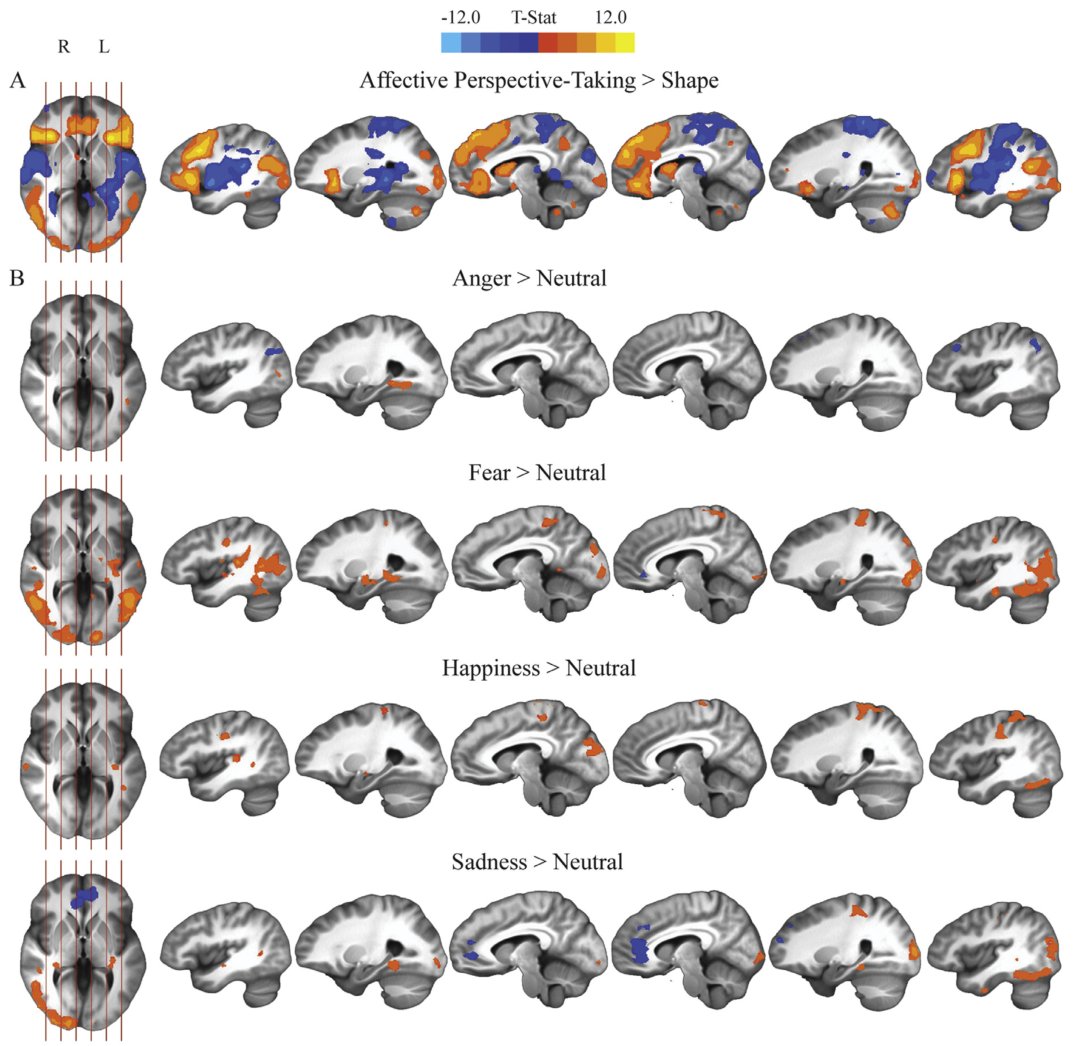
Affective perspective-taking activation maps by emotion
Affective perspective-taking activation maps by emotion. Deming et al. (2020), NeuroImage